

SOLAR PHYSICS · STUDENT GUIDE
Why is the Sun's atmosphere hotter than its surface?
The Sun's surface is about 5,500 °C, yet the thin corona above it reaches about two million degrees. What we know, what Parker Solar Probe measures from inside, the two classic suspects, the 2026 dust idea, and why the probe does not melt. For undergraduate and graduate students.
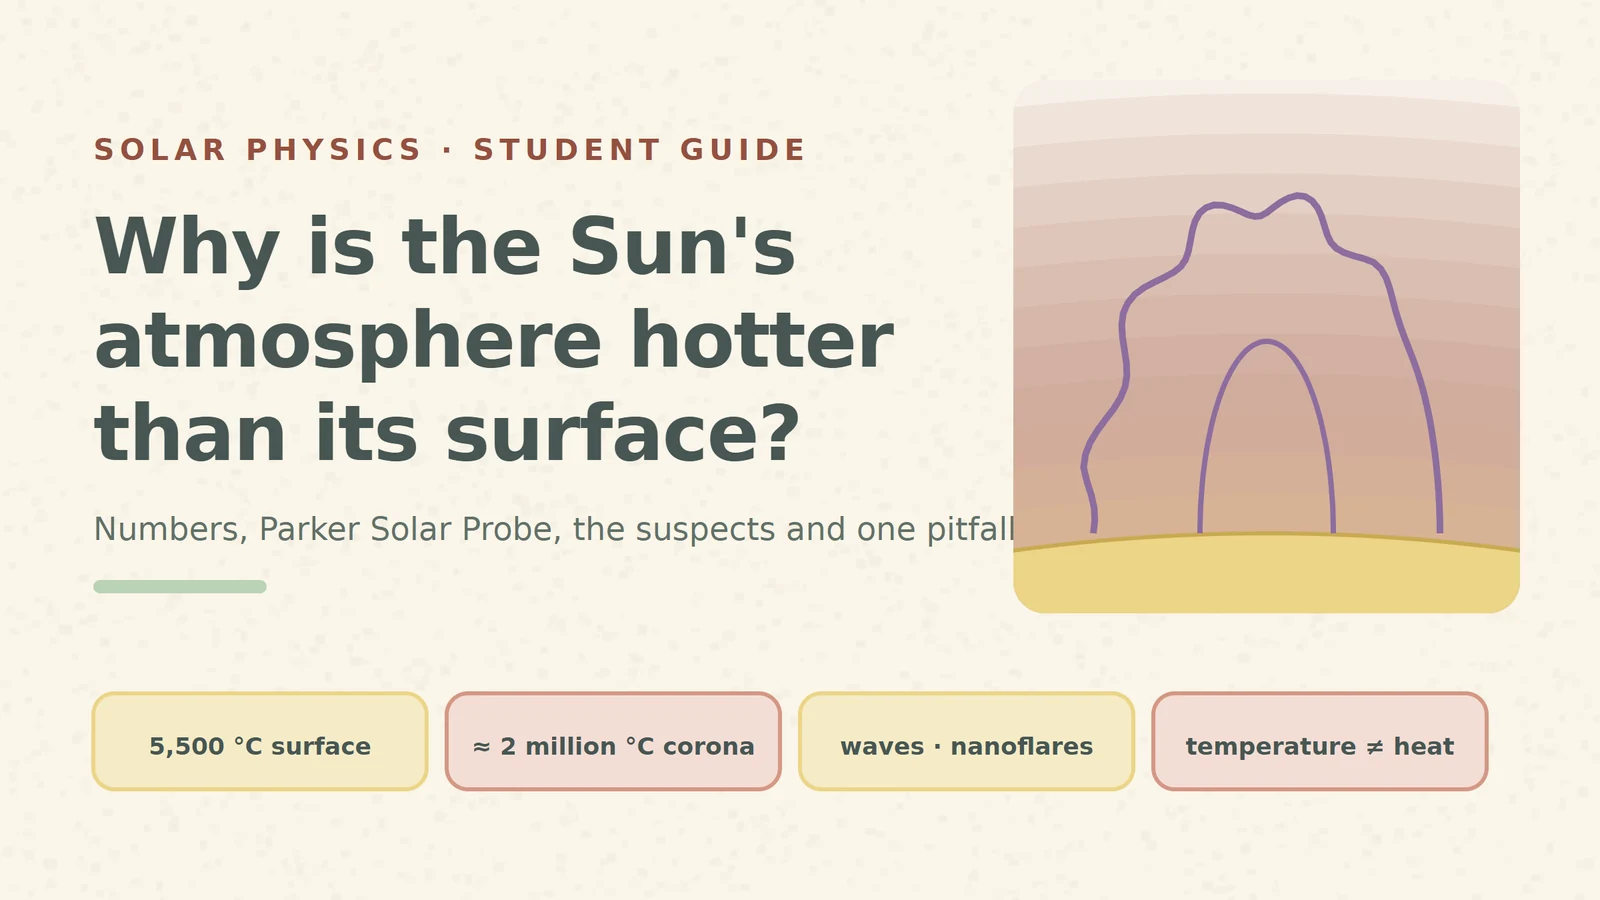
Walk away from a campfire and the air cools. The Sun does the opposite. Its visible surface, the photosphere, is a relatively cool 5,500 °C. The corona above it, the faint crown we see during a total eclipse, reaches about two million degrees Celsius in NASA's round numbers; reviews quote one to three million. Something carries energy upward and dumps it in a gas that is far from the obvious heat source.
This is the coronal heating problem. It has been open since the corona's million-degree temperature was established around 1940, and NASA still calls it one of the Sun's biggest unsolved puzzles. This guide walks through it step by step: the numbers, the measurements, the suspects, a new idea from 2026, and one common mistake.
1. The numbers: hotter going up
Take NASA's rounded values: about 5,500 °C at the surface and about 2,000,000 °C in the corona. Their ratio is the cleanest way to feel the problem.
2,000,000 / 5,500 ≈ 364, so the corona is roughly 360 times hotter than the surface.
Check it yourself: with the upper end of the review range, 3,000,000 / 5,500 ≈ 545; with the lower end, 1,000,000 / 5,500 ≈ 182. Whatever value you take, it is hundreds of times hotter. (Using kelvin barely changes this: add 273 to both.)
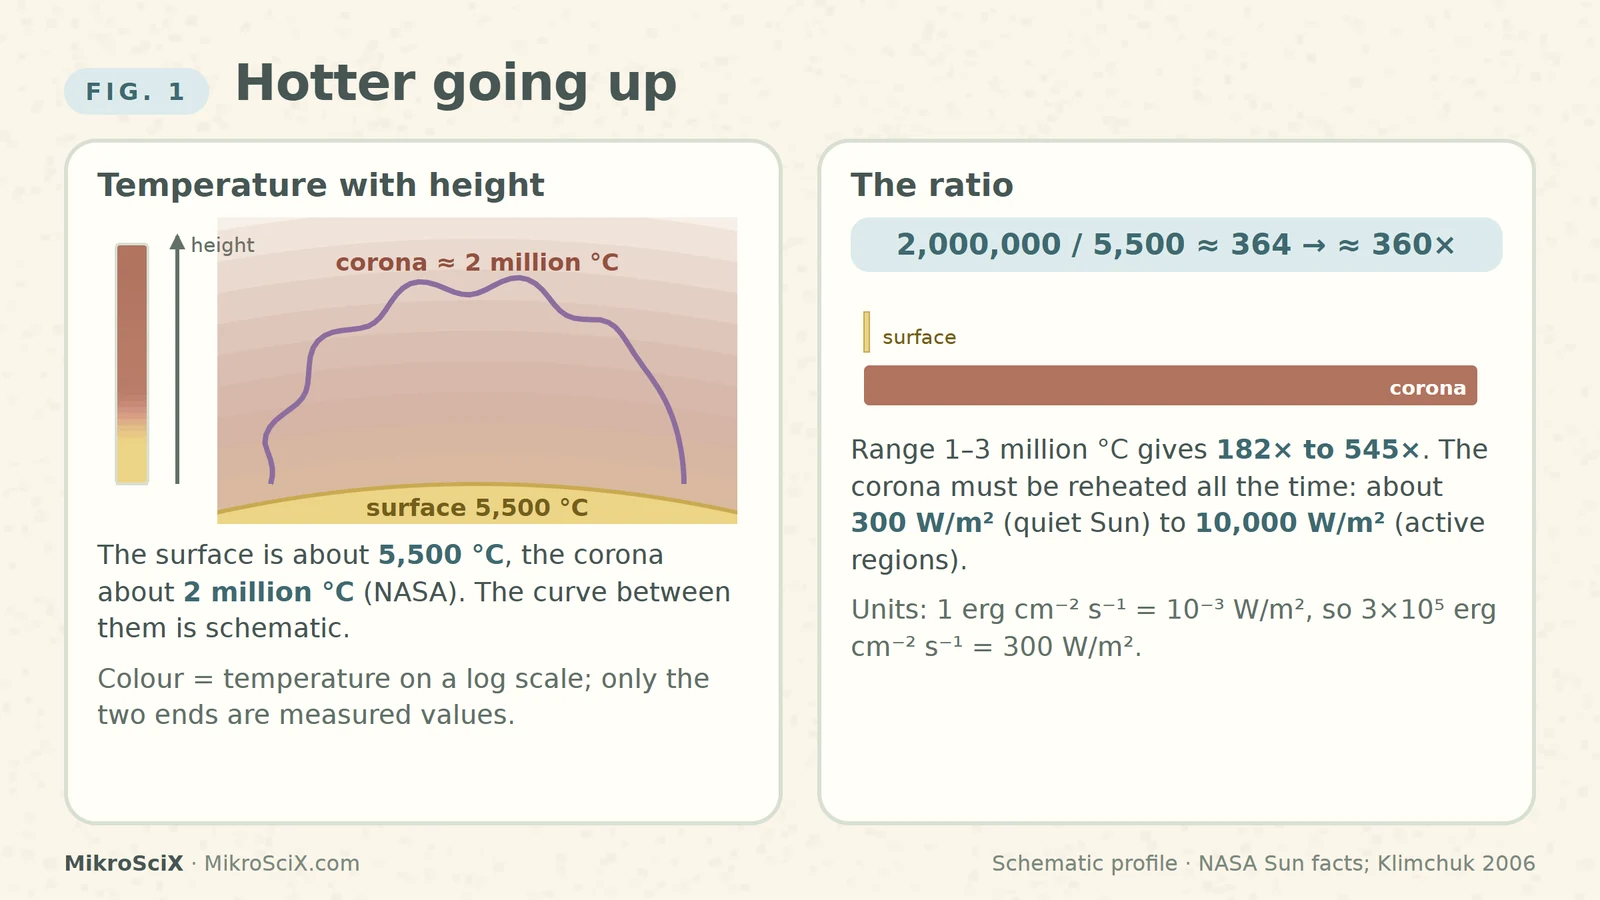
The heat has to be replaced all the time, because the corona loses energy by radiation and by conduction back down. Klimchuk's review puts these losses at roughly 3 × 10⁵ erg per square centimetre per second in the quiet Sun and about 10⁷ in active regions. In SI units that is about 300 W/m² and 10,000 W/m². Any explanation must supply that power, continuously.
What breaks: the smooth curve in our figure is schematic. Only the two end values are measured quantities here; the shape in between depends on where you look on the Sun.
2. Measuring it from inside: Parker Solar Probe
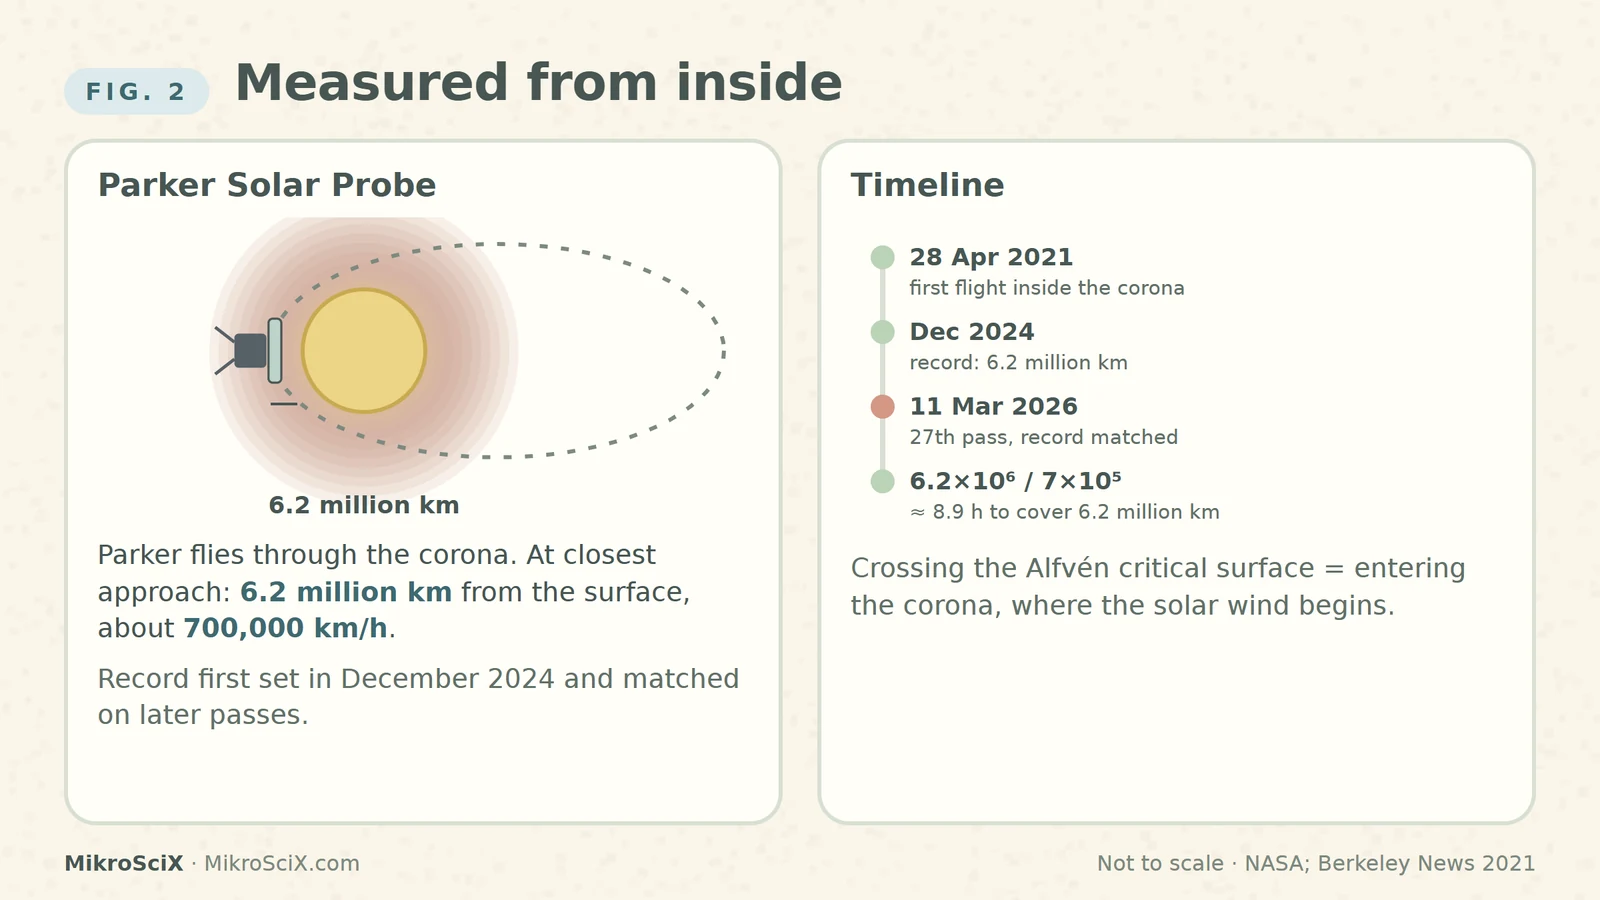
For decades the corona could only be studied from a distance, through its light. NASA's Parker Solar Probe changed that. On 28 April 2021 it crossed the Alfvén critical surface, the boundary where the solar atmosphere ends and the solar wind begins, and for the first time a spacecraft flew through the corona.
Its orbit now brings it closer than ever. On 11 March 2026, on its 27th close approach, Parker again matched its record distance: 6.2 million km (3.8 million miles) from the solar surface, a record first set in December 2024. At closest approach it moves at about 700,000 km/h. Studying the heating of the corona is one of the mission's stated goals.
Check it yourself: at 700,000 km/h, covering 6.2 million km takes 6.2 × 10⁶ / 7 × 10⁵ ≈ 8.9 hours. The probe sweeps through the region it samples in less than half a day per pass.
3. The two classic suspects: waves and nanoflares
Almost everyone agrees on the energy source: the churning convection under the surface. It drags the footpoints of magnetic field lines that reach up into the corona. What happens next depends on how fast the footpoints move compared with the time a magnetic disturbance needs to travel along the field line.
- Fast motions launch waves (AC heating). Shaking a field line sends waves up along it. Of the many wave types, Alfvén waves and Alfvén-like twisting and kink waves are best able to cross the steep layers above the surface, because they are transverse and their energy is guided along the field. In the corona they must then turn into heat.
- Slow motions stress the field (DC heating). If the footpoints wander slowly, the field lines get twisted and braided like strands of a rope. Eugene Parker proposed in 1988 that the stored energy is released in countless small bursts of magnetic reconnection: nanoflares. The canonical nanoflare carries about 10²⁴ erg, which is 10¹⁷ J.
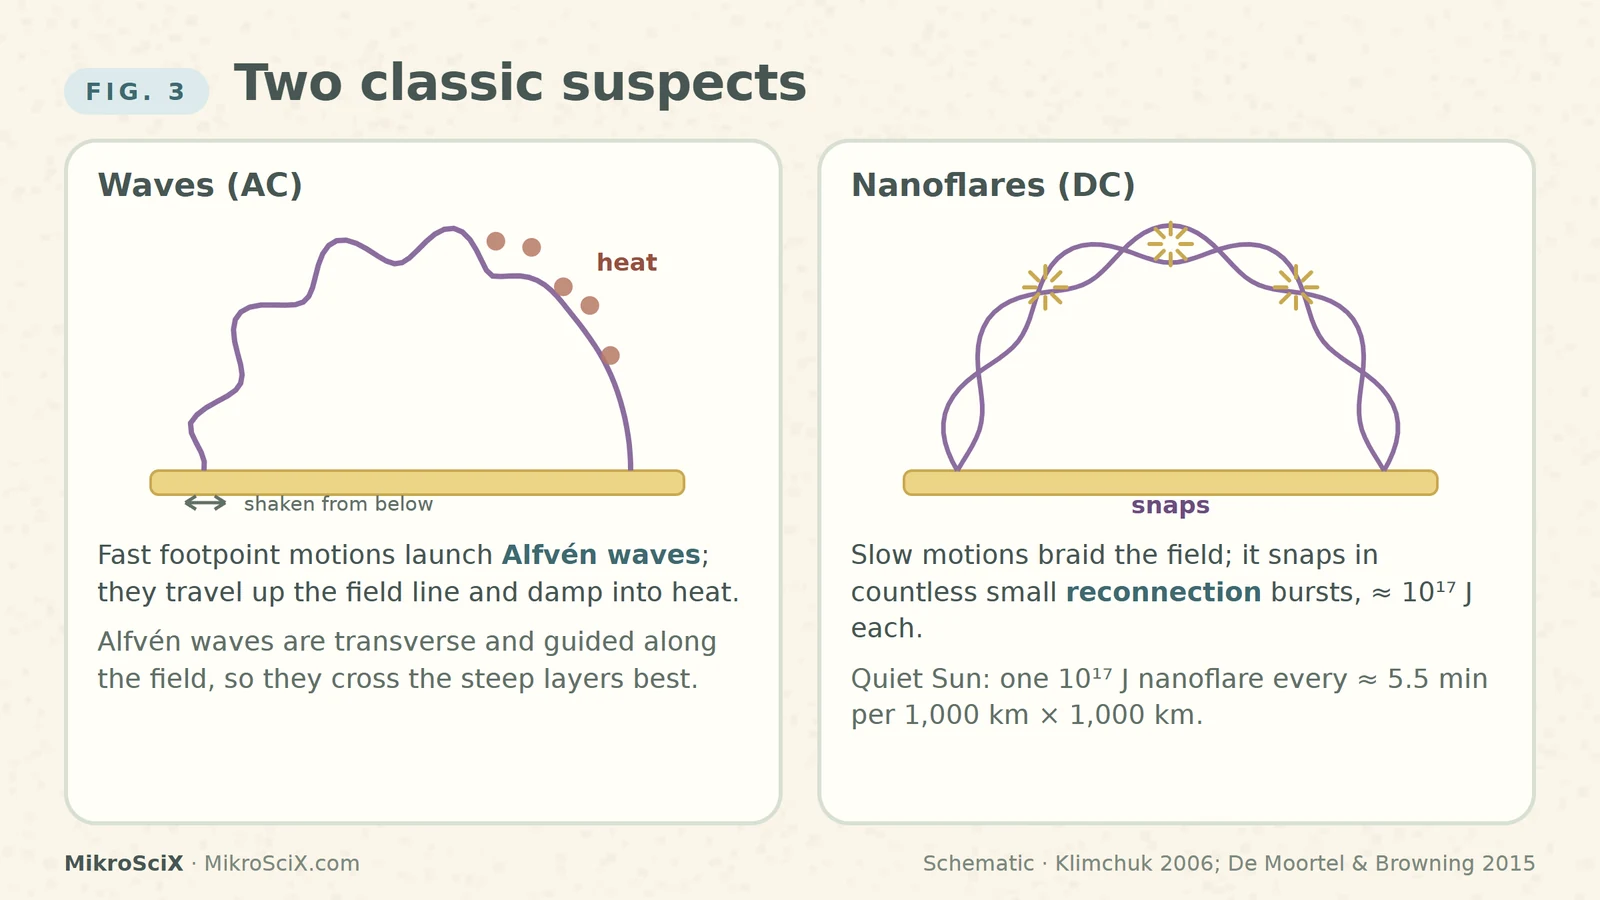
Check it yourself: how many nanoflares would the quiet Sun need? Take a patch 1,000 km × 1,000 km = 10¹² m². At 300 W/m² it loses 3 × 10¹⁴ J every second. Divided by 10¹⁷ J per nanoflare: 0.003 per second, about one every five and a half minutes in that patch. In an active region (10,000 W/m²) it is 0.1 per second, one every ten seconds. Too small to see one by one, but many of them, everywhere.
What breaks: the neat two-box picture. A 2015 review by De Moortel and Browning stresses that waves can drive reconnection and reconnection can launch waves, that turbulence mixes both, and that there is increasing consensus that "the" heating mechanism probably does not exist: different mechanisms may dominate in different places and at different times.
4. New in 2026: does dust change the waves?
Parker also found that the space near the Sun is dustier and more variable than expected. The spacecraft has no dedicated dust detector, but grains hitting it produce sharp voltage spikes on its electric-field antennas.
In July 2026 Ayaz and colleagues published a study in The Astrophysical Journal that feeds these measurements into a model of kinetic Alfvén waves. Using Parker data from about 10 to 20 solar radii, they find two opposite effects. A higher dust charge density makes the waves damp faster, so their energy is handed to particles locally, as heat. A higher dust mass loading weakens the damping, so the energy travels farther before it is released. Where the energy ends up could therefore depend on the dust.
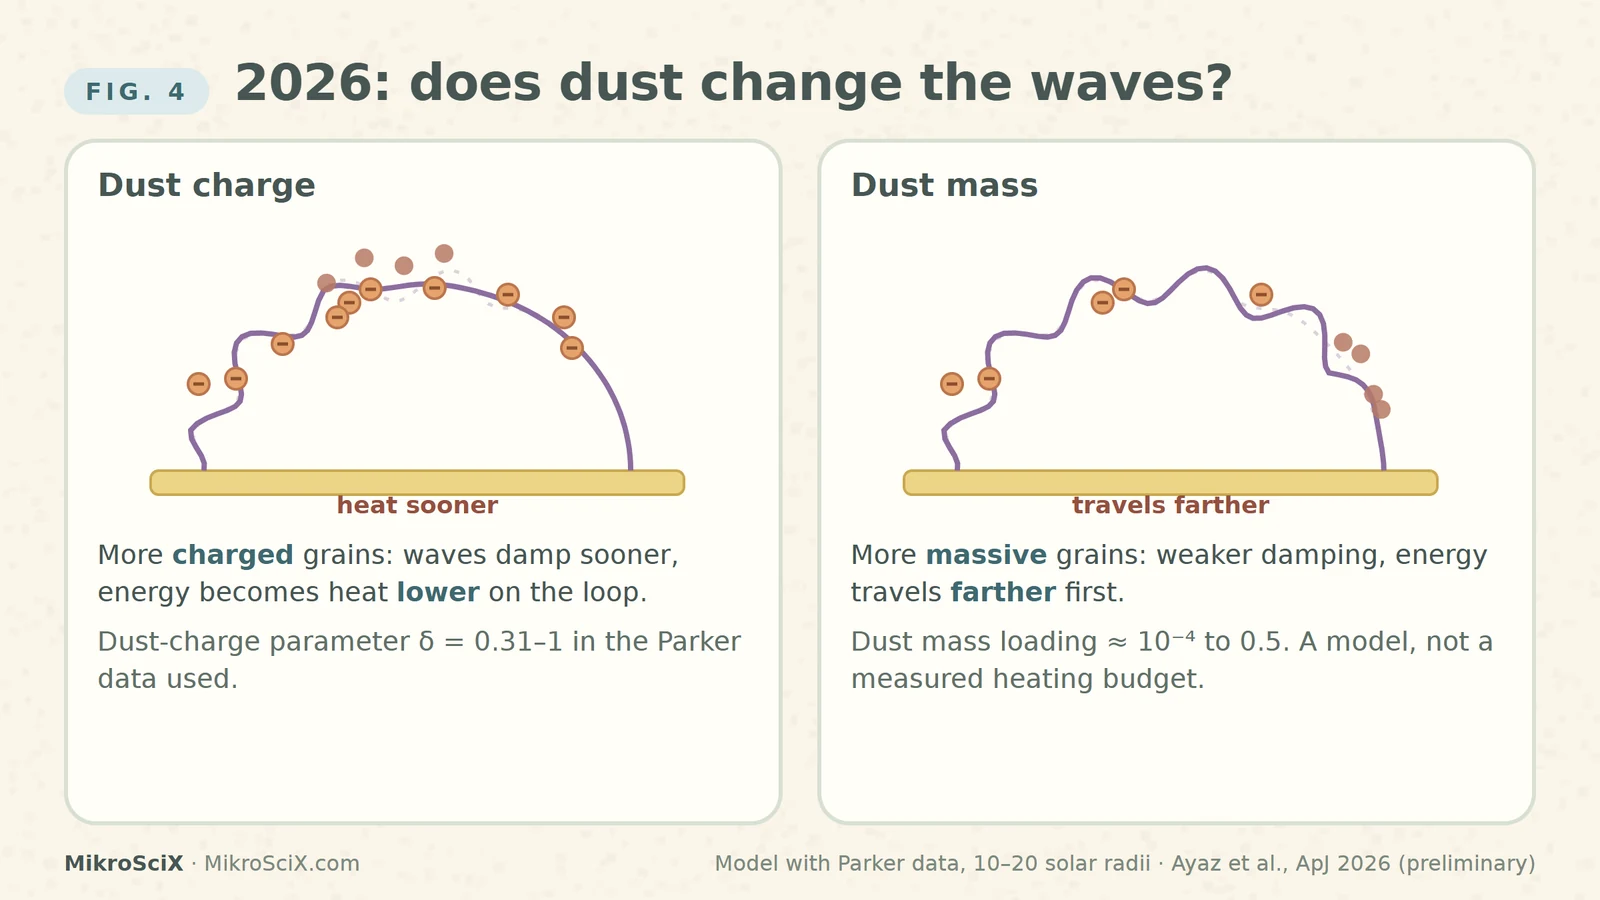
What breaks: this is not a third, independent heater. It refines the wave picture, it is a model fed by one period of data (late June and early July 2024), and the university's own release calls it a preliminary study. The authors ask for future missions with dedicated dust and plasma instruments.
5. The pitfall: why doesn't Parker melt?
If the corona is two million degrees, how does a spacecraft fly through it? Because temperature is not heat. Temperature measures how fast the particles move. Heat is the energy they actually hand over. The corona is extremely hot but extremely thin, so very few particles hit the probe, and little energy is transferred.
NASA's own comparison: you can put your hand into a hot oven for a moment, but not into a pot of boiling water at a much lower temperature. The water has far more particles touching your skin.
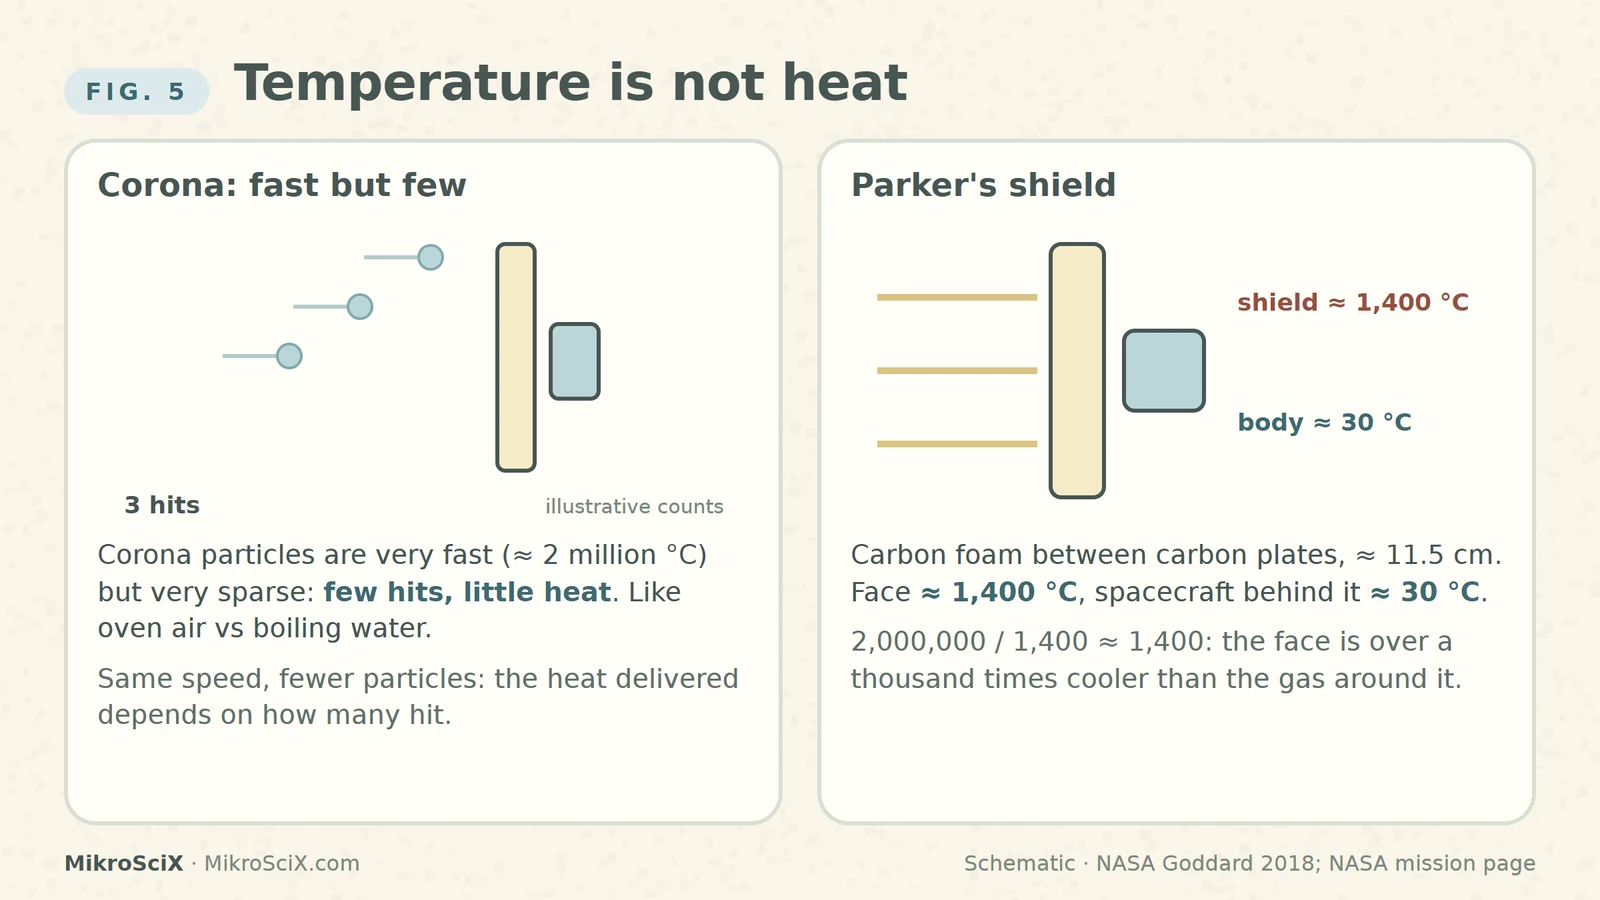
Parker still faces the Sun at close range, and its shield protects it. The shield is carbon foam sandwiched between two carbon plates, about 11.5 cm thick, with a white coating on the sunward side. At closest approach its face reaches about 1,400 °C, while the spacecraft and instruments behind it sit at about 30 °C.
Check it yourself: 2,000,000 / 1,400 ≈ 1,400. The shield face is more than a thousand times cooler than the gas around it, because the gas is too thin to heat it further.
How to read the evidence
- Waves: look for wave energy that disappears with height and heating where it disappears.
- Nanoflares: look for signs of many small, impulsive heating events, such as very hot plasma traces in active regions.
- Dust: look for heating that tracks the measured dust charge and mass.
- All of them: remember that the answer may differ between quiet Sun, active regions and open-field regions.
The corona is hundreds of times hotter than the surface, magnetic fields carry the energy up, and nobody yet knows which mix of waves, nanoflares and perhaps dust releases it.
Try it yourself
- A textbook quotes the corona at 1.5 million °C. How many times hotter than the 5,500 °C surface is that?
- An active-region patch of 2,000 km × 2,000 km loses 10,000 W/m². How many 10¹⁷ J nanoflares per second would balance it?
- Why can't you conclude that Parker's shield must reach the corona's temperature?
Answers: (1) 1,500,000 / 5,500 ≈ 273 times. (2) Area 4 × 10¹² m², power 4 × 10¹⁶ W, so 4 × 10¹⁶ / 10¹⁷ = 0.4 nanoflares per second. (3) Because heat transfer depends on how many particles hit, not only on how fast they move; the corona is so thin that the shield exchanges little energy with it.
Watch the short
Videos don’t load automatically. The videos are hosted on YouTube. Allow YouTube once and every video on the site loads by itself; your choice is remembered. The articles never need consent.
Sources
- NASA Science — Sun: Facts
- NASA Science — Parker Solar Probe mission page
- NASA Parker Solar Probe blog — NASA's Parker Solar Probe Makes 27th Swing Around the Sun (16 March 2026)
- NASA Goddard — Traveling to the sun: Why won't Parker Solar Probe melt? (via ScienceDaily, 2018)
- I. De Moortel, P. Browning — Recent advances in coronal heating, Phil. Trans. R. Soc. A 373, 20140269 (2015)
- J. A. Klimchuk — On Solving the Coronal Heating Problem, Solar Physics 234, 41 (2006)
- S. Ayaz et al. — Parker Solar Probe Observations of Dust Mass and Charge Densities and Their Impact on Kinetic Alfvén Wave Dynamics in Solar Coronal Heating, ApJ 1005, 133 (2026)
- UAH — Cosmic dust could play key role in cracking the solar corona heating mystery (1 July 2026)
- Berkeley News — Parker Solar Probe touches the sun, a first for any spacecraft (14 December 2021)
Diagrams are schematic and not to scale; the temperature profile between surface and corona is illustrative. The ratios (≈ 360, 545, 182, 1,400), the nanoflare counts and the 8.9-hour crossing are our own arithmetic from the cited values (Klimchuk 2006 losses and canonical nanoflare energy; NASA temperatures, distance and speed).