

SOLAR CELL PARAMETERS
Solar cell parameters, worked out: Isc, Voc, fill factor and efficiency from one curve
Forty milliamps and 0.60 volts do not make 24 milliwatts. A step-by-step guide to reading the two ends of an I–V curve, finding the maximum power point, computing the fill factor, converting the area, and getting an efficiency you can actually compare. For undergraduate and graduate students.
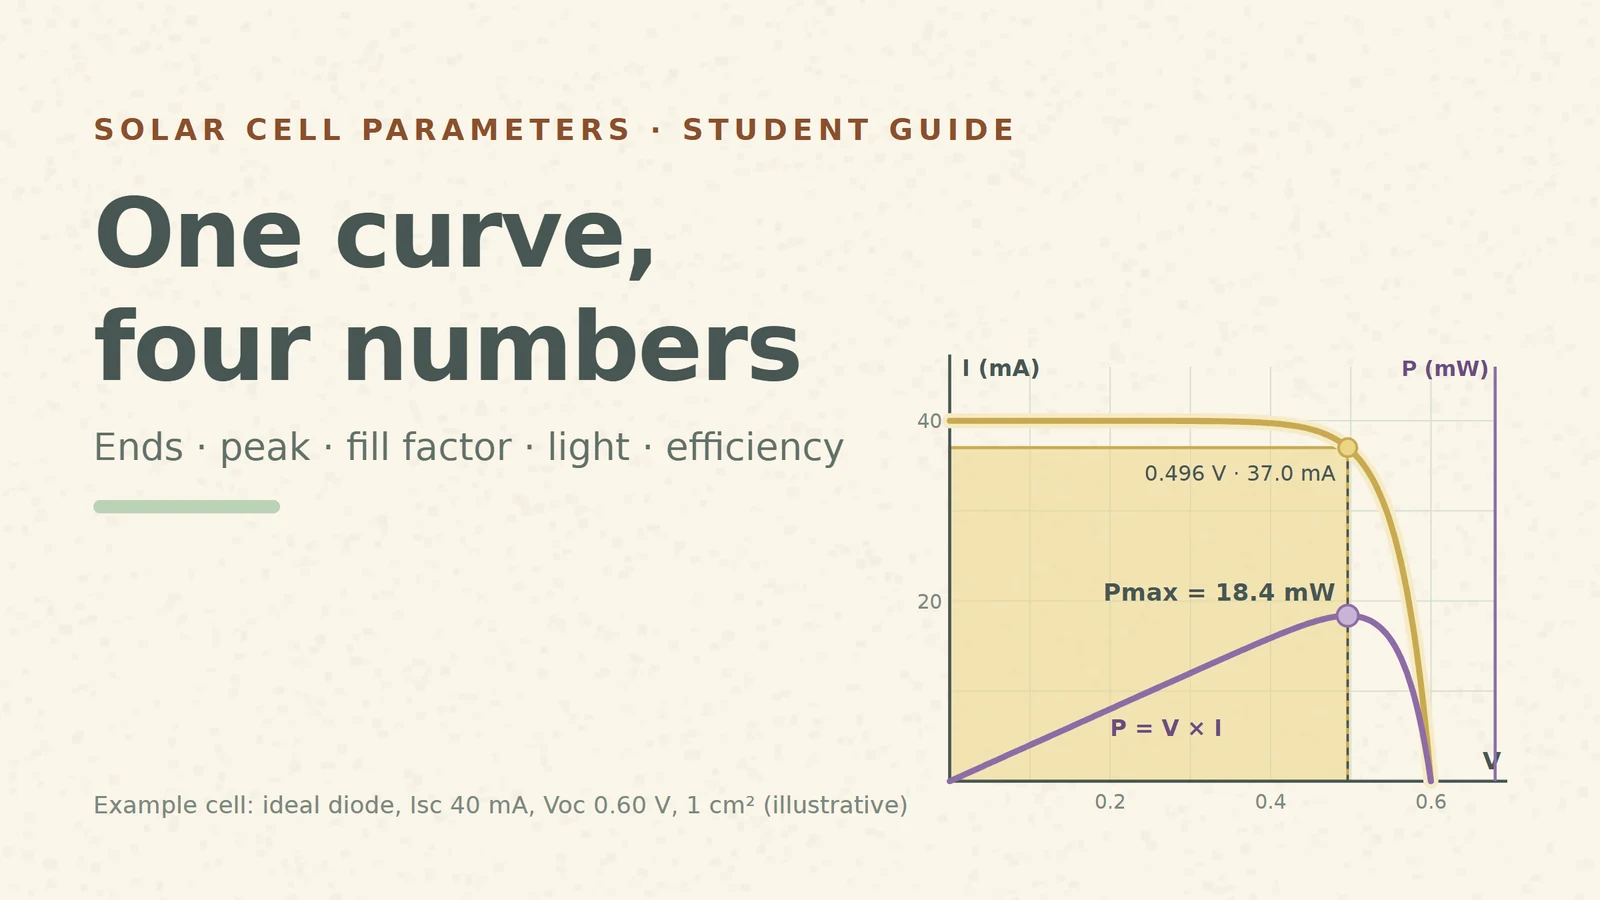
A solar cell datasheet, a lab report and a research paper all boil the I–V curve down to a few numbers: Isc, Voc, FF and η, often with Jsc. They look like four independent facts. They are not: every one of them comes from the same curve, and three of them come from one point on it. If you can compute them yourself from a curve, you can also spot when a reported set does not add up.
This guide follows one example cell from start to finish. It is an ideal diode with the cell equation I = IL − I0[exp(V/VT) − 1] [S1], light-generated current IL = 40 mA, VT = 0.04 V and I0 chosen so that the open-circuit voltage is exactly 0.60 V. Its area is 1 cm². These are teaching values, not measurements, and the same example cell runs through our whole solar series. Current is drawn positive when the cell delivers it, the usual way PV curves are plotted [S1].
1. The two ends: Isc and Voc
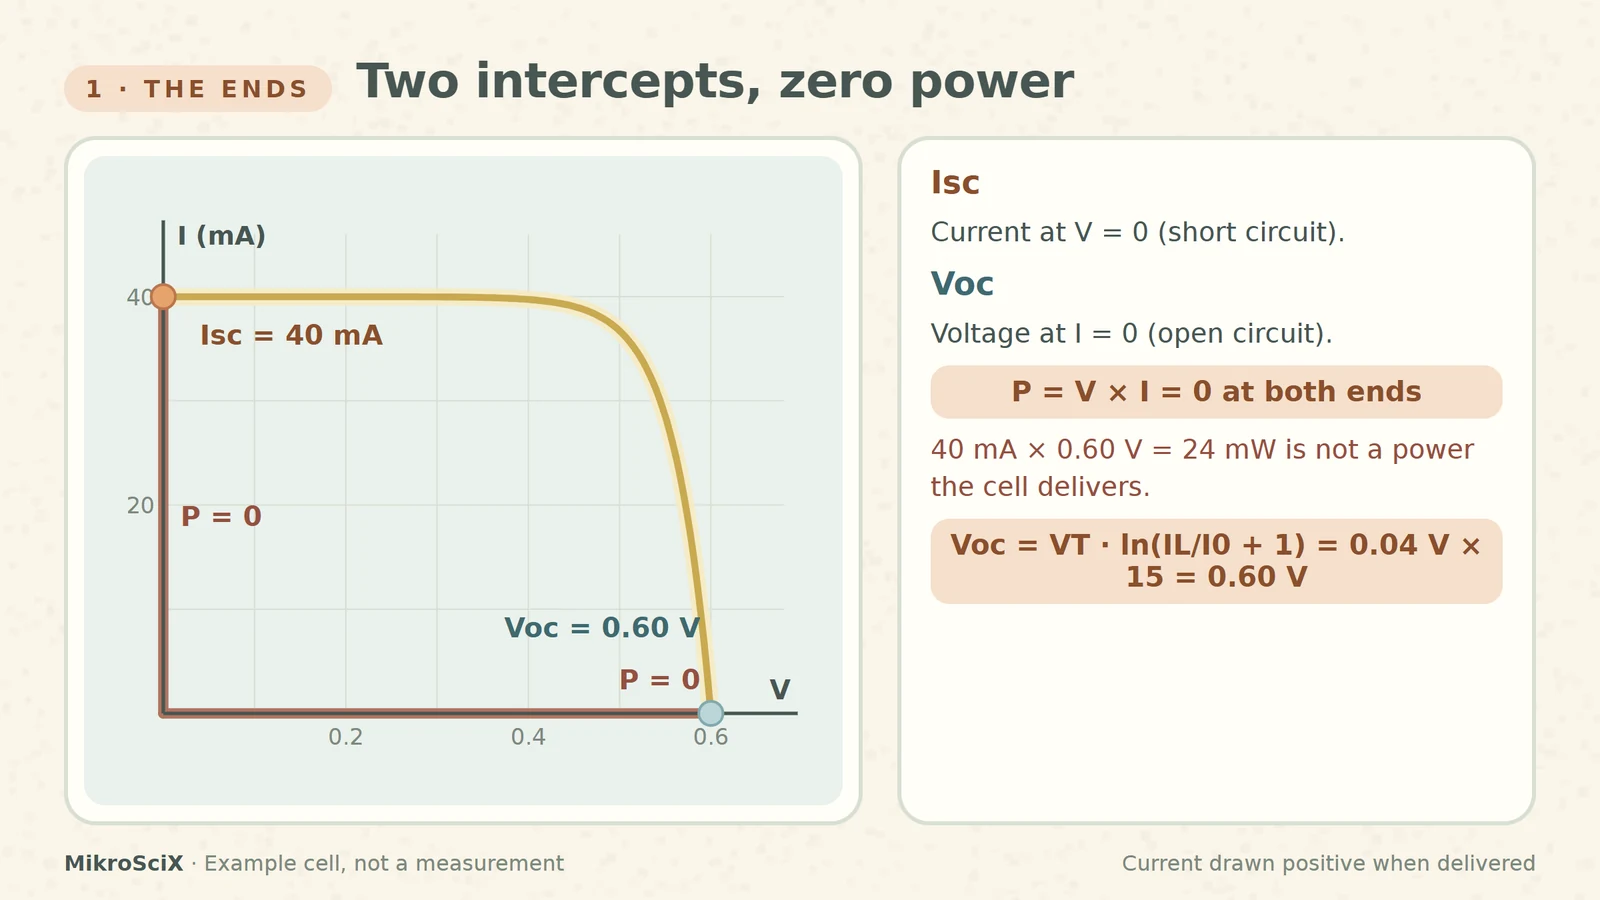
The short-circuit current Isc is the current through the cell when the voltage across it is zero [S2]. The open-circuit voltage Voc is the largest voltage the cell can give, reached when no current flows [S3]. On the curve they are the two intercepts: Isc on the current axis, Voc on the voltage axis.
Both ends have one thing in common: the cell delivers no power there. At short circuit V = 0, at open circuit I = 0, so V × I = 0 at both points [S4]. They are the limits of the curve, not operating points you would ever use.
Check it yourself. At V = 0 the exponential term is exp(0) − 1 = 0, so I = IL = 40 mA. Setting I = 0 gives Voc = VT · ln(IL/I0 + 1) [S3]; with I0 = 40 mA / (e15 − 1) that is 0.04 V × 15 = 0.60 V.
What breaks:
- Multiplying the intercepts. 40 mA × 0.60 V = 24 mW looks like the cell's power, but the cell never sits at both ends at once.
- Reading Isc at a small but non-zero voltage. On a flat curve the error is tiny; on a curve that slopes near zero volts (a leaky cell) it is not.
2. The peak: P = V × I at every point
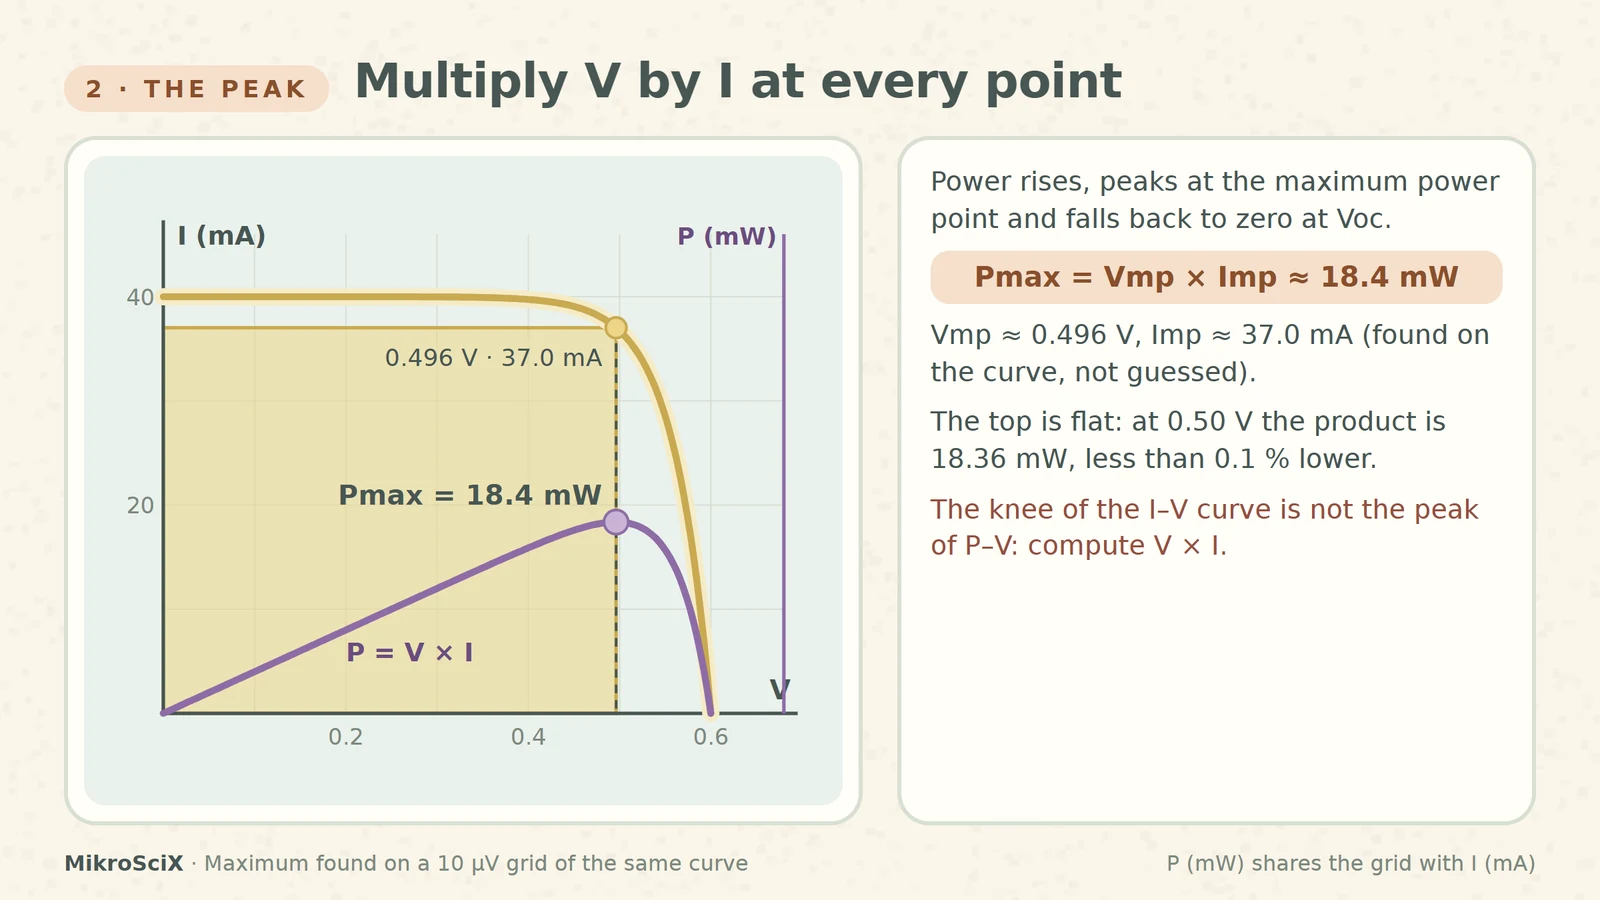
Between the ends the cell delivers power P = V × I. Starting from short circuit the voltage rises faster than the current falls, so the power grows; near the knee the current collapses and the power drops back to zero at Voc. The top of that hill is the maximum power point, Pmax = Vmp × Imp [S1][S6]. Geometrically, Pmax is the area of the largest rectangle that fits under the curve with one corner at the origin and the opposite corner on the curve [S4].
Check it yourself. Tabulate V × I for the example cell:
- 0.40 V × 39.73 mA = 15.89 mW
- 0.45 V × 39.06 mA = 17.58 mW
- 0.48 V × 38.01 mA = 18.24 mW
- 0.496 V × 37.03 mA = 18.37 mW (the maximum, found on a 10 µV grid)
- 0.50 V × 36.72 mA = 18.36 mW
- 0.52 V × 34.59 mA = 17.99 mW
- 0.55 V × 28.54 mA = 15.70 mW
So Vmp ≈ 0.496 V, Imp ≈ 37.0 mA and Pmax ≈ 18.4 mW. Notice how flat the top is: at a round 0.50 V the product is 18.36 mW, less than 0.1 % below the peak. That is why measured MPPs are often quoted to two digits of voltage.
What breaks:
- Taking the "knee" by eye. The knee of the I–V curve and the peak of the P–V curve are close but not the same point; compute V × I.
- Using too few points. A coarse sweep can miss the top; a flat peak forgives small voltage errors, but not a missing region.
3. Fill factor: two rectangles
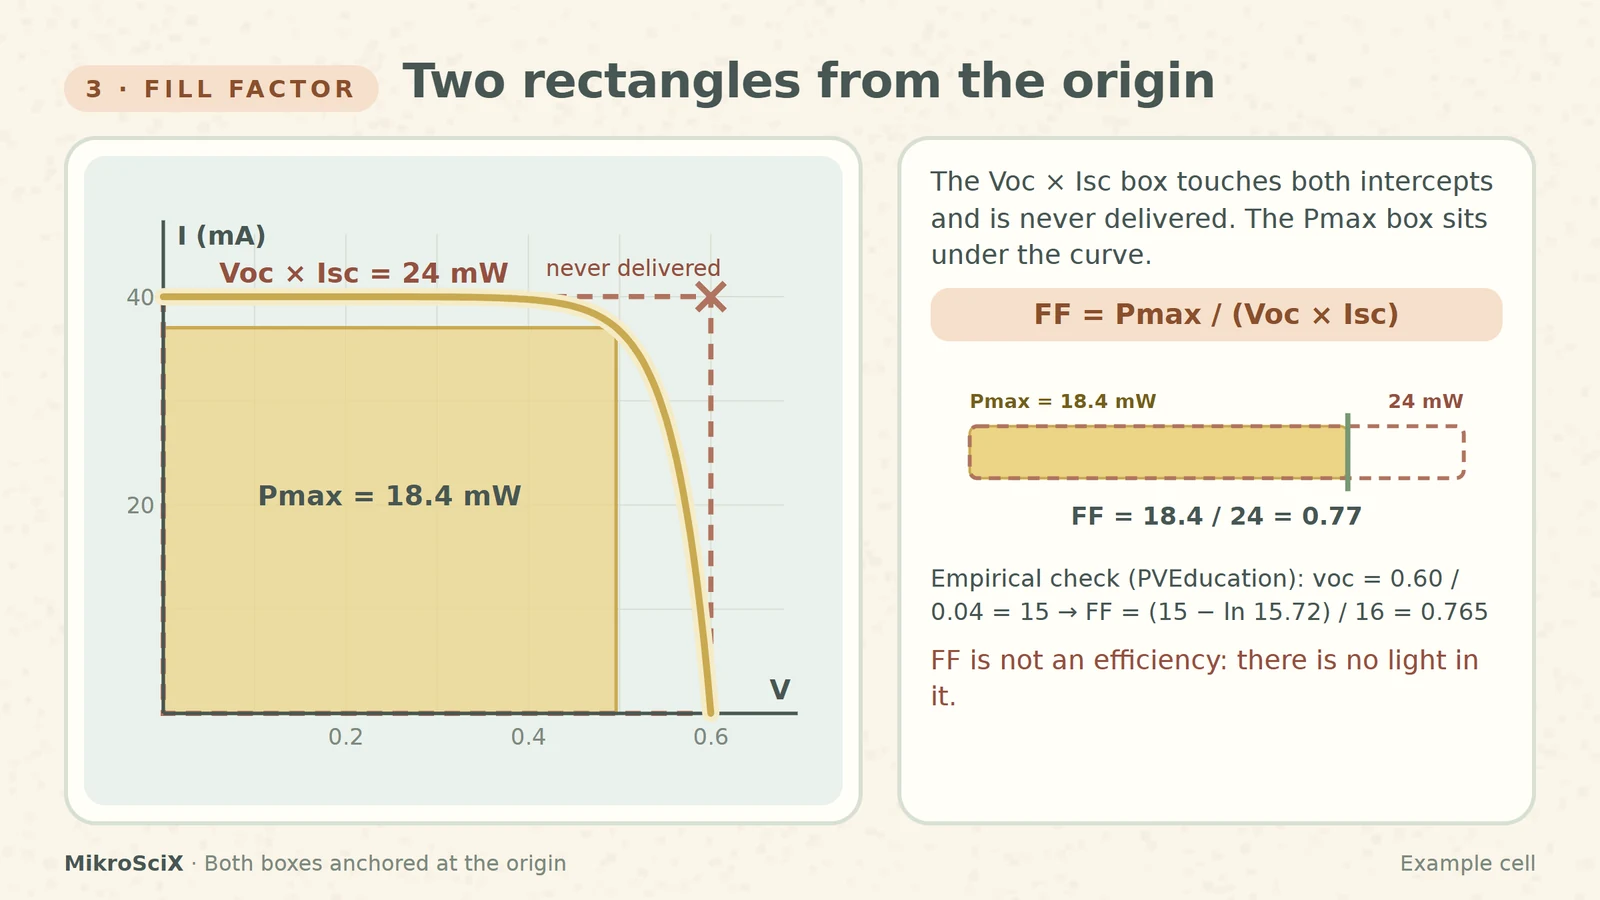
The fill factor compares the real peak with the ideal-looking product of the two ends: FF = Pmax / (Voc × Isc) [S4][S6]. Draw both rectangles from the origin: the Voc × Isc box touches both intercepts and is a power the cell never delivers; the Pmax box sits under the curve. FF tells you how much of the big box the small one fills, a measure of how "square" the curve is [S4].
Check it yourself. Voc × Isc = 0.60 V × 40 mA = 24 mW. FF = 18.37 / 24 = 0.765, which rounds to 0.77 (the rounded values give the same: 18.4 / 24 = 0.767). PVEducation gives an empirical expression for an ideal cell in terms of the normalized voltage voc = Voc / (nkT/q): FF = (voc − ln(voc + 0.72)) / (voc + 1) [S4]. Our cell has voc = 0.60 / 0.04 = 15, and the formula gives 0.765 as well.
What breaks:
- Calling FF an efficiency. FF = 0.77 does not mean 77 % of the light becomes electricity. It is a ratio of two powers taken from the same curve, with no light in it.
- Forgetting what lowers it. Resistance losses tilt the curve and shrink the Pmax box while Voc × Isc barely changes, so FF drops (our series-and-shunt-resistance video works through that).
4. Light in: Pin = G × A, units first
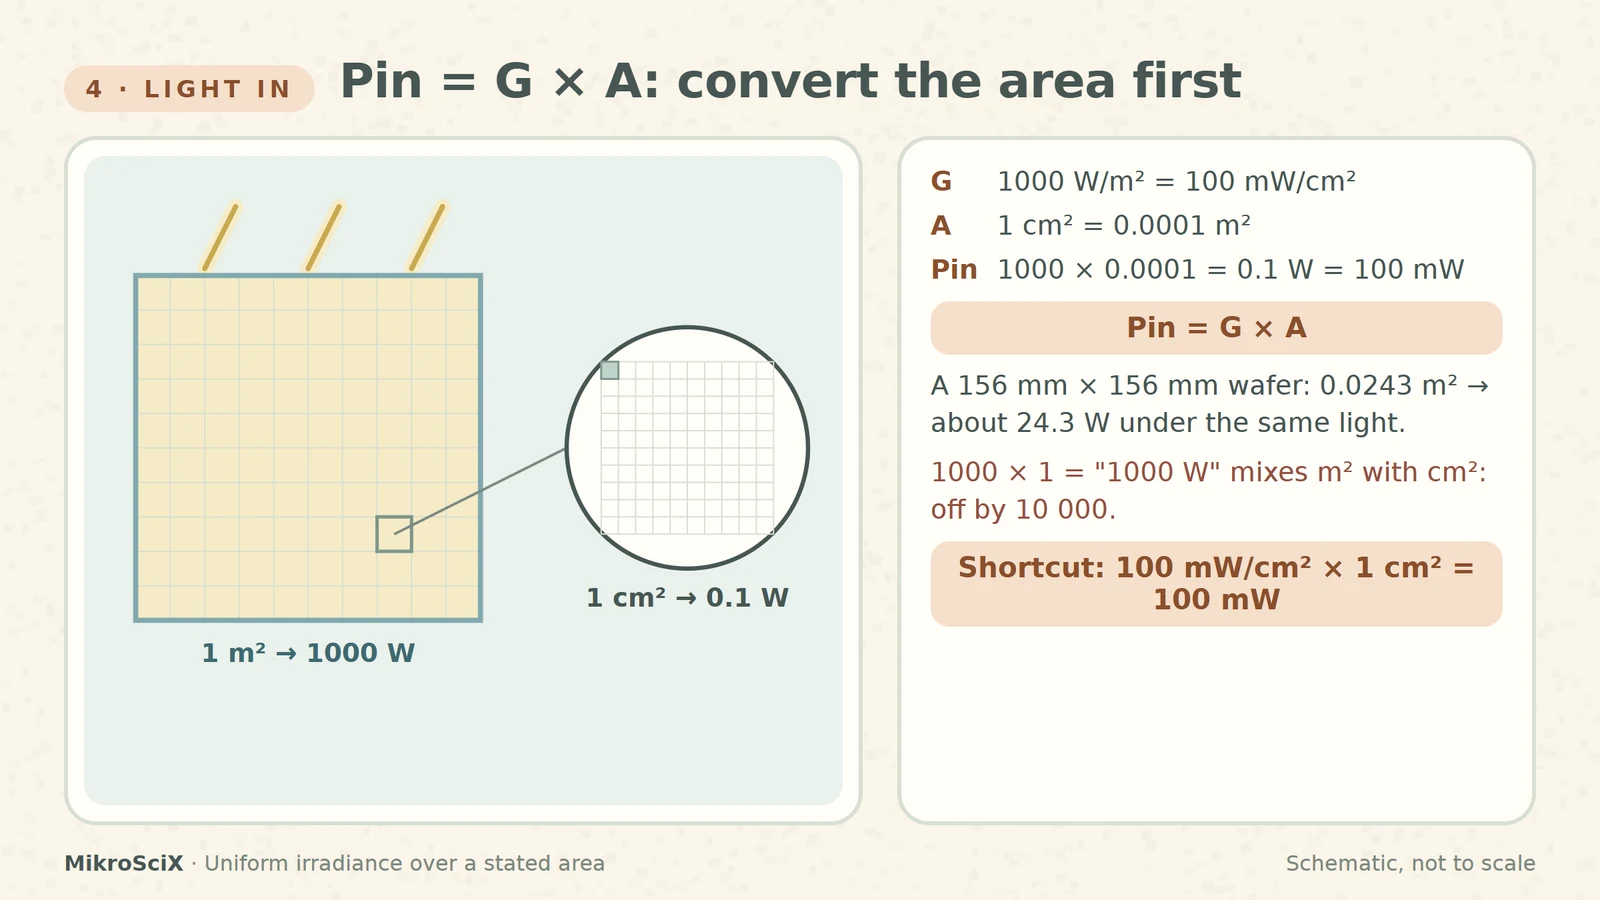
To get an efficiency you need the light power that falls on the cell. Irradiance G is a power per area, so the incident power is Pin = G × A. Terrestrial cells are rated at G = 1000 W/m², which is the same as 100 mW/cm² [S5]. The area must be in the same unit as G before you multiply.
Check it yourself. 1 cm² = (0.01 m)² = 0.0001 m². Pin = 1000 W/m² × 0.0001 m² = 0.1 W = 100 mW. Or directly: 100 mW/cm² × 1 cm² = 100 mW. A 156 mm × 156 mm wafer has 0.0243 m² and receives about 24.3 W under the same light [S5].
What breaks:
- Mixing cm² and m². 1000 × 1 = "1000 W" for a fingernail-sized cell is off by a factor of 10 000.
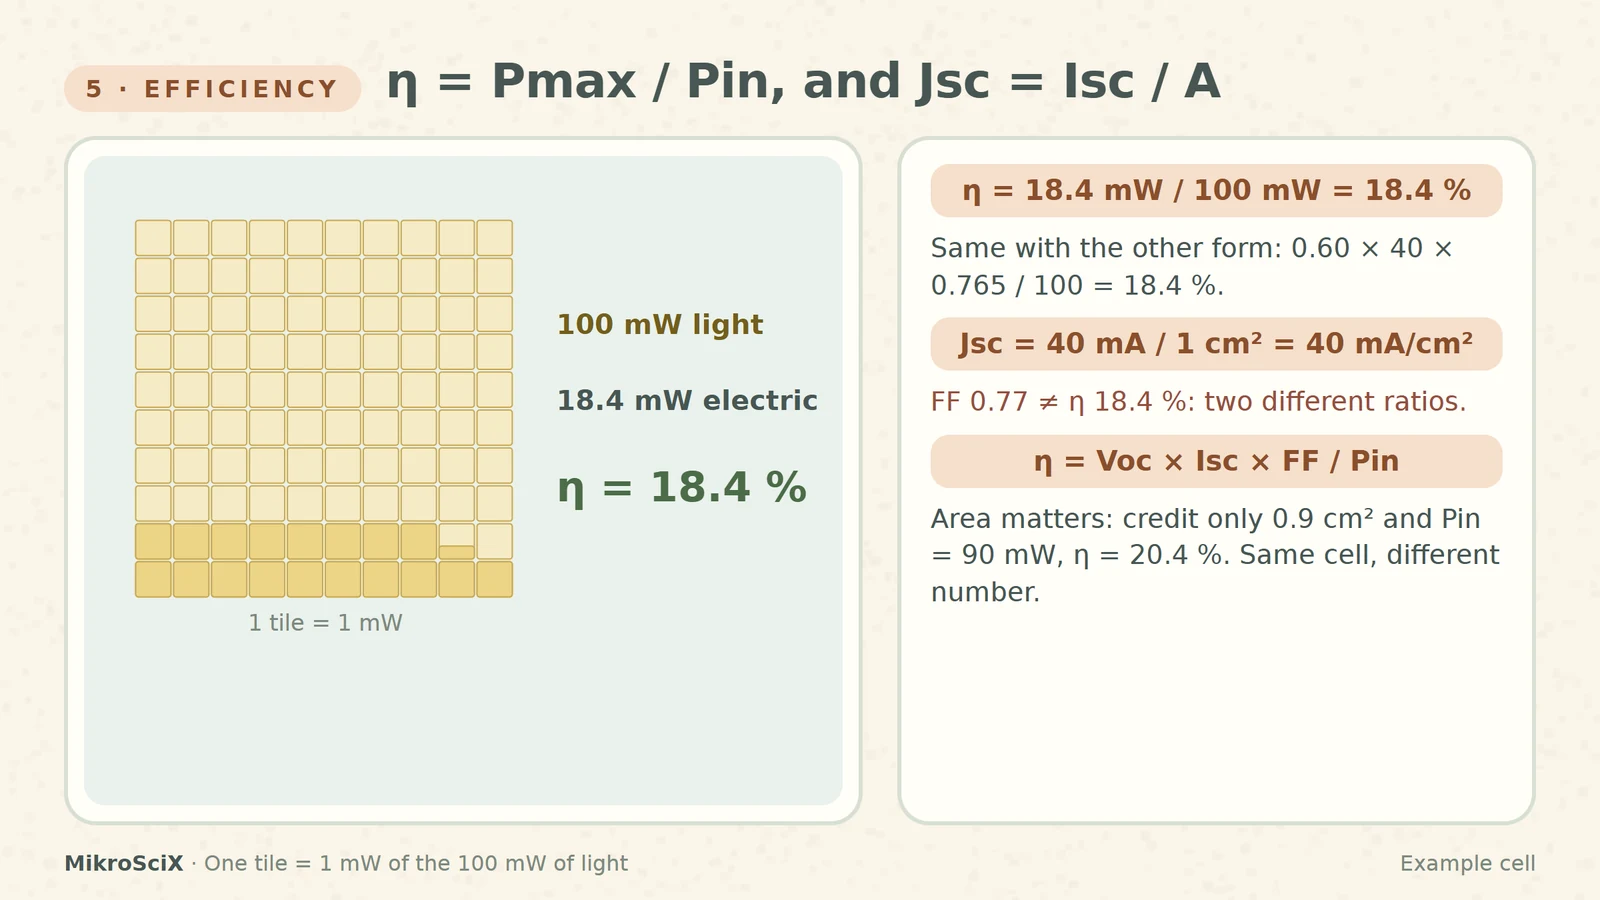
- Changing the area definition. If the same cell were credited with only 0.9 cm² of illuminated area, Pin would be 90 mW and η would jump from 18.4 % to 20.4 %. The area convention must be stated.
5. Efficiency and Jsc
Efficiency is the fraction of incident power converted to electricity: η = Pmax / Pin, equivalently η = Voc × Isc × FF / Pin [S5][S6]. The current density Jsc = Isc / A, usually in mA/cm², removes the cell's size from the current so different cells can be compared [S2]; measurement software derives it once you enter the area [S6].
Check it yourself. η = 18.37 mW / 100 mW = 18.4 %. Cross-check through the other form: 0.60 V × 40 mA × 0.765 / 100 mW = 18.4 %. Jsc = 40 mA / 1 cm² = 40 mA/cm².
What breaks:
- Quoting Isc instead of Jsc. A bigger cell gives more current without being any better; per area, they may be equal.
- Comparing efficiencies under different light. The number only means something with its conditions.
6. Report the conditions
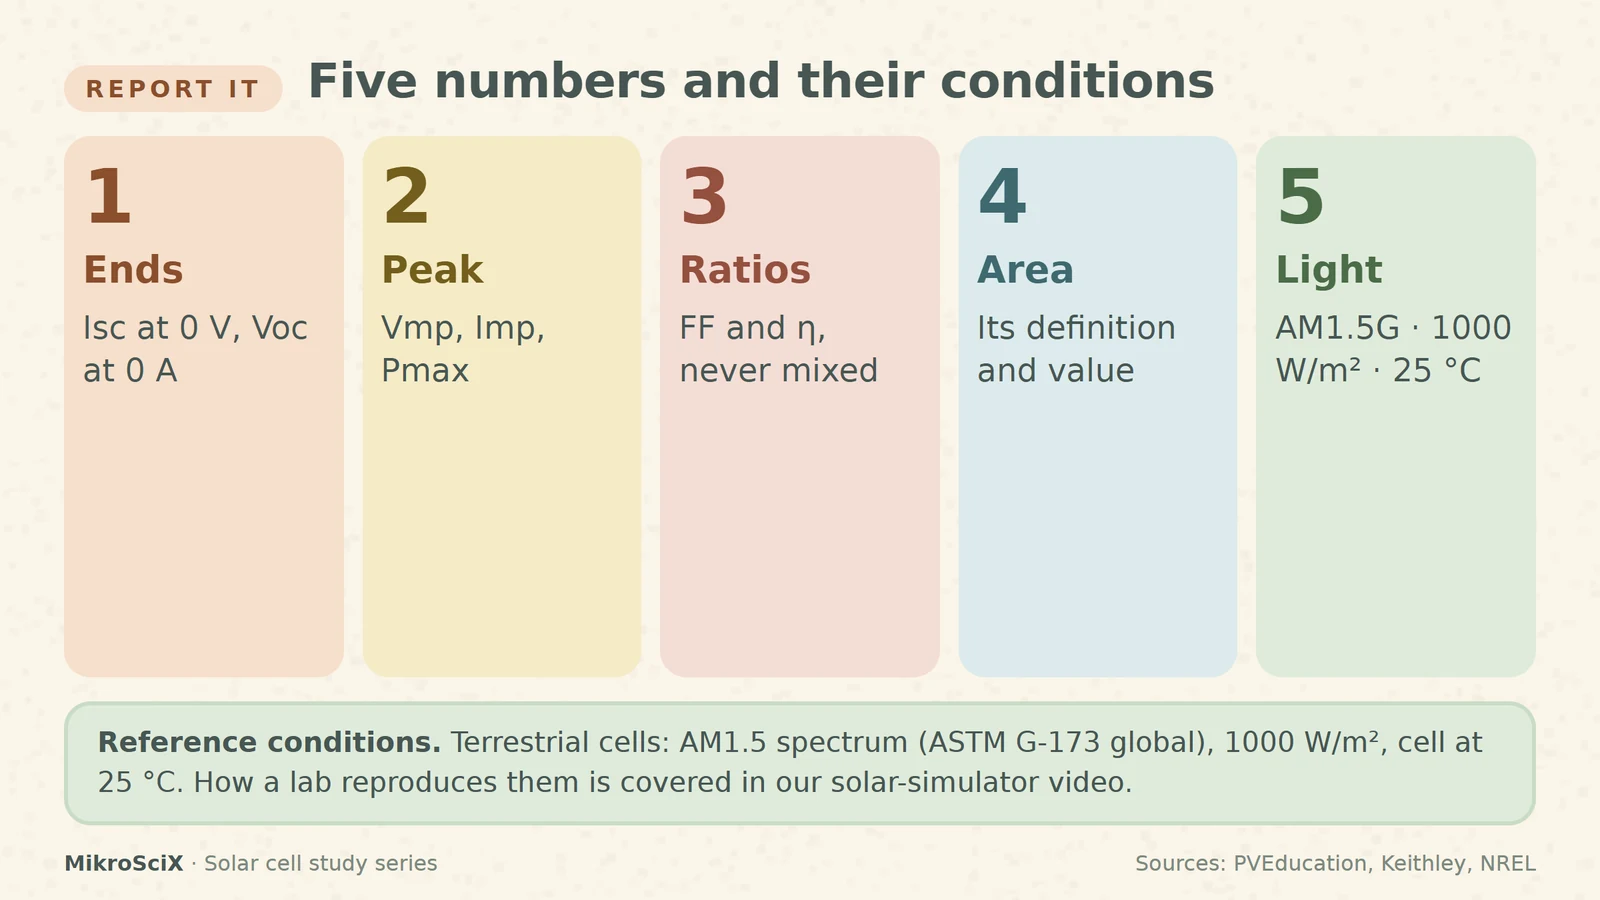
Terrestrial cells are measured under the AM1.5 spectrum at a cell temperature of 25 °C, with 1000 W/m² as the input power for efficiency [S5]. The AM1.5 global spectrum is a published reference (ASTM G-173) meant to give everyone one common basis [S7]. Write AM1.5G, 1000 W/m², 25 °C and the area definition next to Isc, Voc, FF and η. How a lab actually reproduces these conditions (solar simulators, reference cells, masks) is a topic of its own and is covered in our solar-simulator video.
The whole calculation on one line
- Ends: Isc at V = 0, Voc at I = 0 → 40 mA, 0.60 V.
- Peak: maximise V × I → 0.496 V × 37.0 mA = 18.4 mW.
- Fill factor: 18.4 / (0.60 × 40) = 0.77.
- Light: 1000 W/m² × 0.0001 m² = 100 mW.
- Efficiency and Jsc: 18.4 / 100 = 18.4 %; 40 mA / 1 cm² = 40 mA/cm².
Two ends with zero power, one peak, two ratios: FF compares the peak with Voc × Isc, efficiency compares it with the light. Convert the area first and always say under which light.
Try it yourself
- A cell has Isc = 35 mA, Voc = 0.62 V and Pmax = 16.0 mW. What is its fill factor? 0.62 × 35 = 21.7 mW; FF = 16.0 / 21.7 = 0.74.
- A 2 cm² cell delivers Pmax = 36 mW at 1000 W/m². Efficiency? Pin = 1000 × 0.0002 = 0.2 W = 200 mW; η = 36 / 200 = 18 %.
- A 156 mm × 156 mm cell gives Isc = 9.0 A. Jsc? A = 15.6 × 15.6 = 243.4 cm²; Jsc = 9000 mA / 243.4 cm² ≈ 37.0 mA/cm².
- Someone reports FF = 0.80 and η = 80 %. What is wrong? FF and η are different ratios; an 80 % efficiency would need the light power, not Voc × Isc, in the denominator, and is far beyond a single junction under one sun.
Watch the short
Videos don’t load automatically. The videos are hosted on YouTube. Allow YouTube once and every video on the site loads by itself; your choice is remembered. The articles never need consent.
Sources
- PVEducation — IV Curve
- PVEducation — Short-Circuit Current
- PVEducation — Open-Circuit Voltage
- PVEducation — Fill Factor
- PVEducation — Solar Cell Efficiency
- Keithley / Tektronix — Application Note 3026: Electrical characterization of photovoltaic materials and solar cells with the Model 4200-SCS
- NREL — Reference Air Mass 1.5 Spectra
Plots are schematic. All curves and numbers come from one ideal-diode example cell (IL 40 mA, VT 0.04 V, Voc 0.60 V, 1 cm²) and are illustrative, not measurements.