

SOLAR CELL PARAMETERS
Series and shunt resistance: where a solar cell loses its power, and how to read it from the I–V curve
Two cells, same light, same Voc, same Isc, and one gives a quarter less power. The difference hides in two resistors that every real cell carries. Where they come from, which end of the I–V curve each one bends, how to estimate them and why the quick estimates mislead. For undergraduate and graduate students.
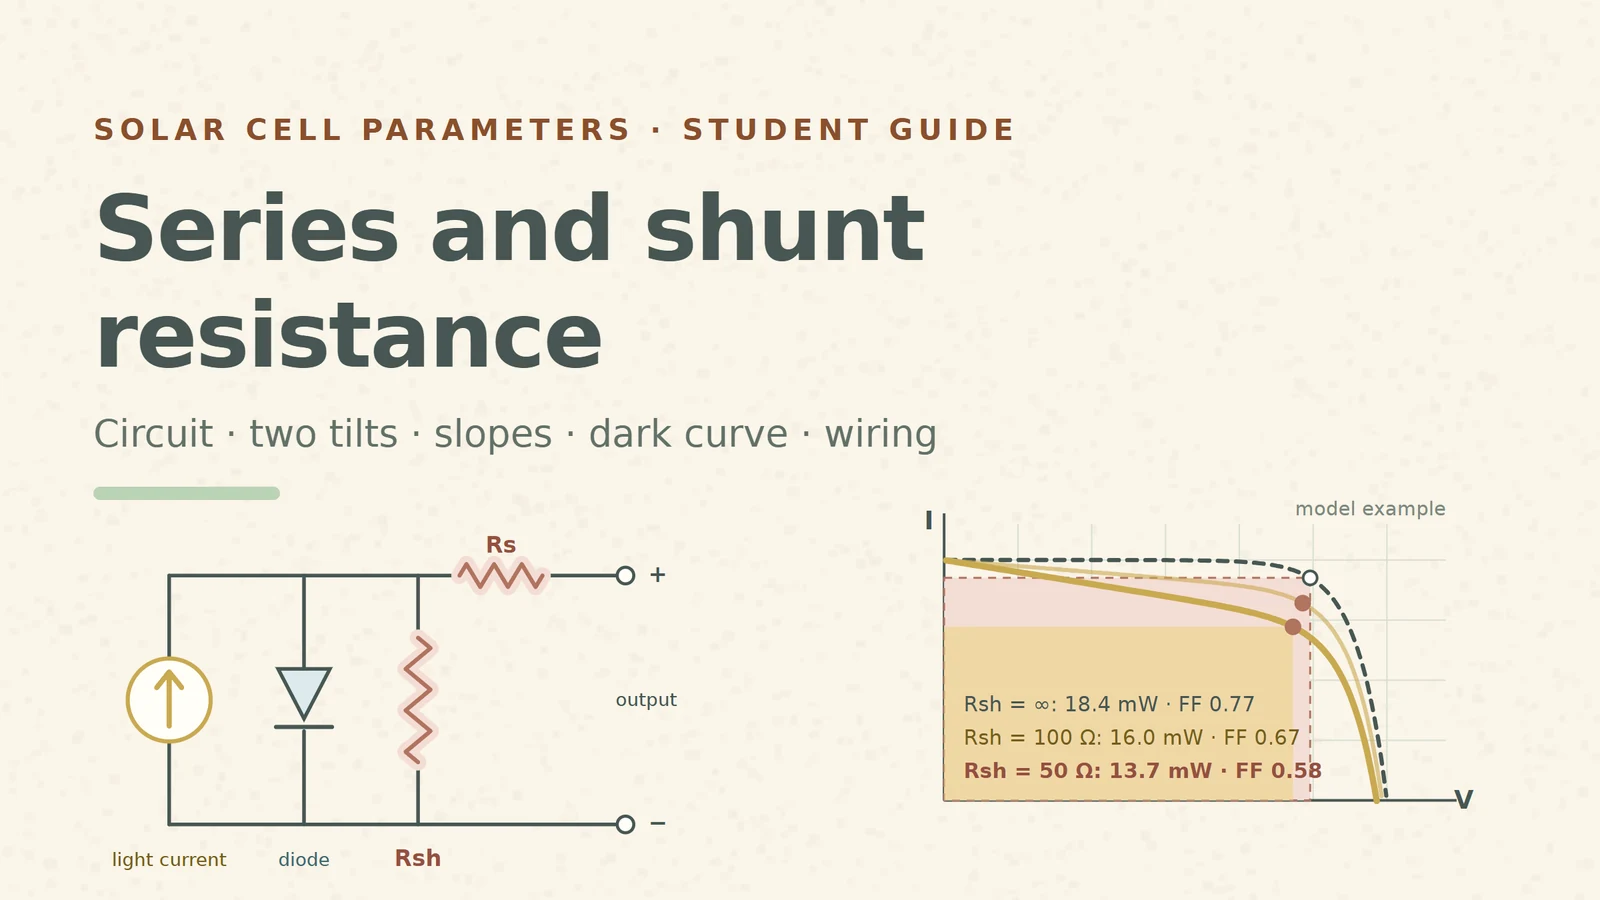
An ideal solar cell is a current source and a diode. Its I–V curve has a flat top near short circuit, a sharp knee and a steep drop to open circuit. Real curves are softer: the top leans, the knee rounds off, the drop is less steep. Most of that softening comes from two parasitic resistances, and their main effect is to lower the fill factor [S9].
All numbers in this guide come from one model cell, the same example used across our solar-cell series: light current IL = 40 mA, VT = n·kT/q = 0.04 V, Voc = 0.60 V, area 1 cm². Without resistances it gives Pmax ≈ 18.4 mW at 0.496 V and 37.0 mA, a fill factor of about 0.77. The resistance values below are deliberately worse than in good cells so the changes are easy to see. They are teaching values, not measurements.
1. The circuit inside every cell
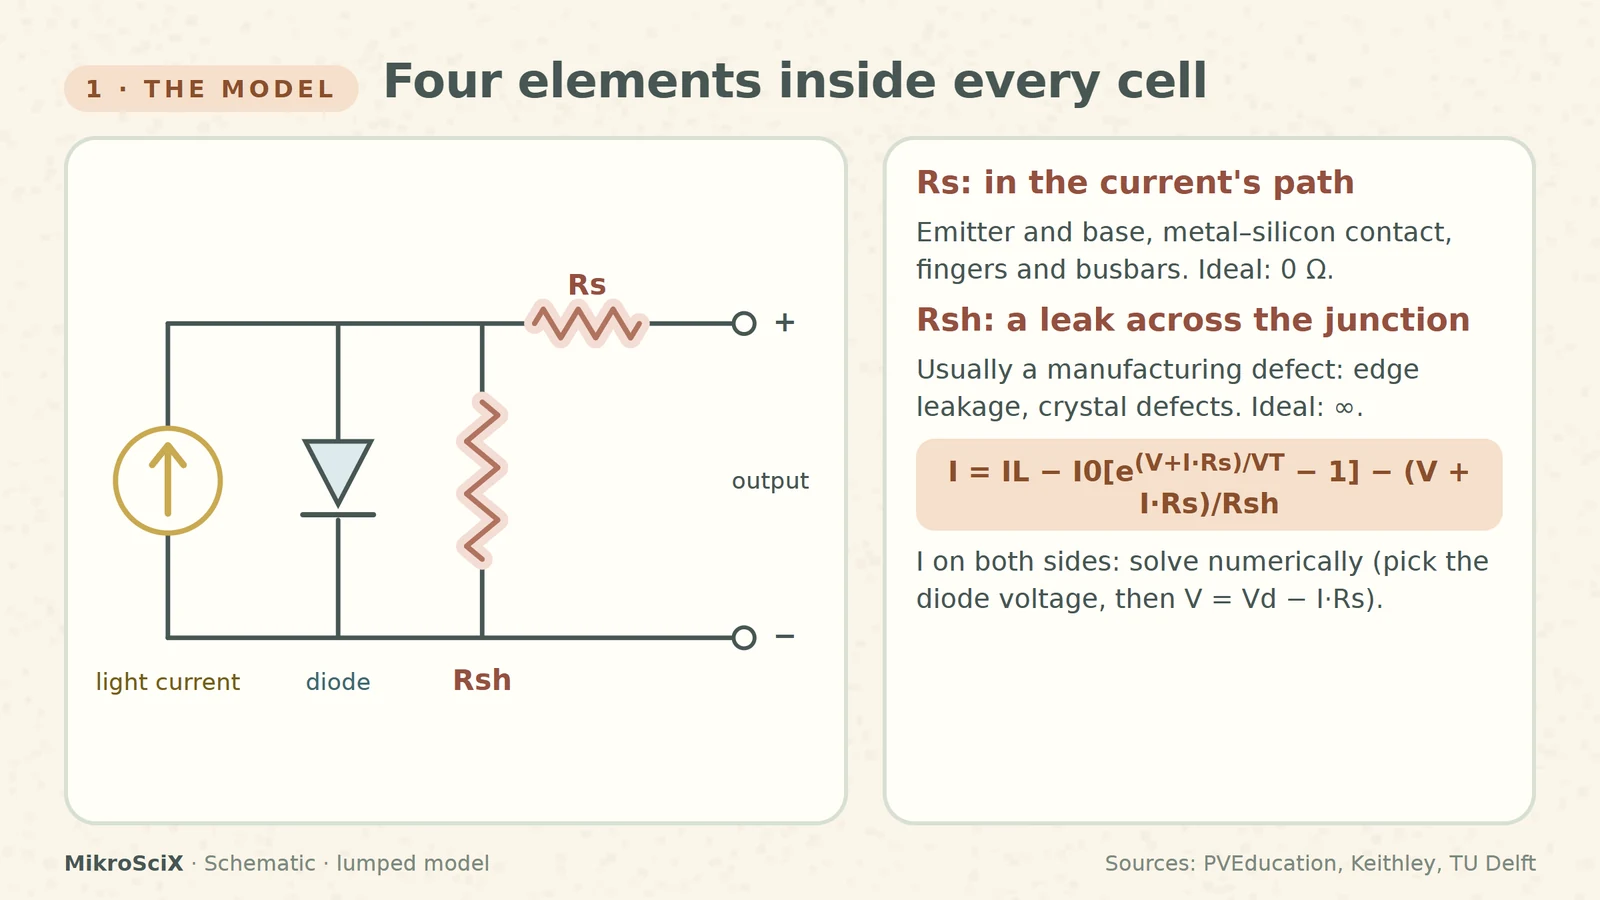
The standard single-diode model puts four elements together: a light-generated current source, a diode in parallel with it, a shunt resistance Rsh across both, and a series resistance Rs between them and the terminals [S6][S7]. Its equation is
I = IL − I0[exp((V + I·Rs)/(n·kT/q)) − 1] − (V + I·Rs)/Rsh
The current I appears on both sides, so the curve has to be solved numerically [S1]. A practical trick: pick the voltage across the diode, compute the current from it, and then the terminal voltage V = Vdiode − I·Rs. That is how every curve here was drawn.
Where Rs comes from. The current has to flow sideways through the emitter and up through the base, cross the metal–silicon contact, and run along the metal fingers and busbars [S1][S6]. Every one of those paths has resistance. Ideally Rs = 0 [S6].
Where a low Rsh comes from. A significant shunt is usually a manufacturing defect, not a design choice [S2]: leakage along the edge of the cell or through crystal defects [S6]. Ideally Rsh is infinite [S6].
What breaks: the model is lumped. A real cell is a three-dimensional network of resistors and diodes, and its apparent Rs changes with the current level; a series resistance that affects only part of the cell can even look like a low shunt [S5].
2. Series resistance bends the knee near Voc
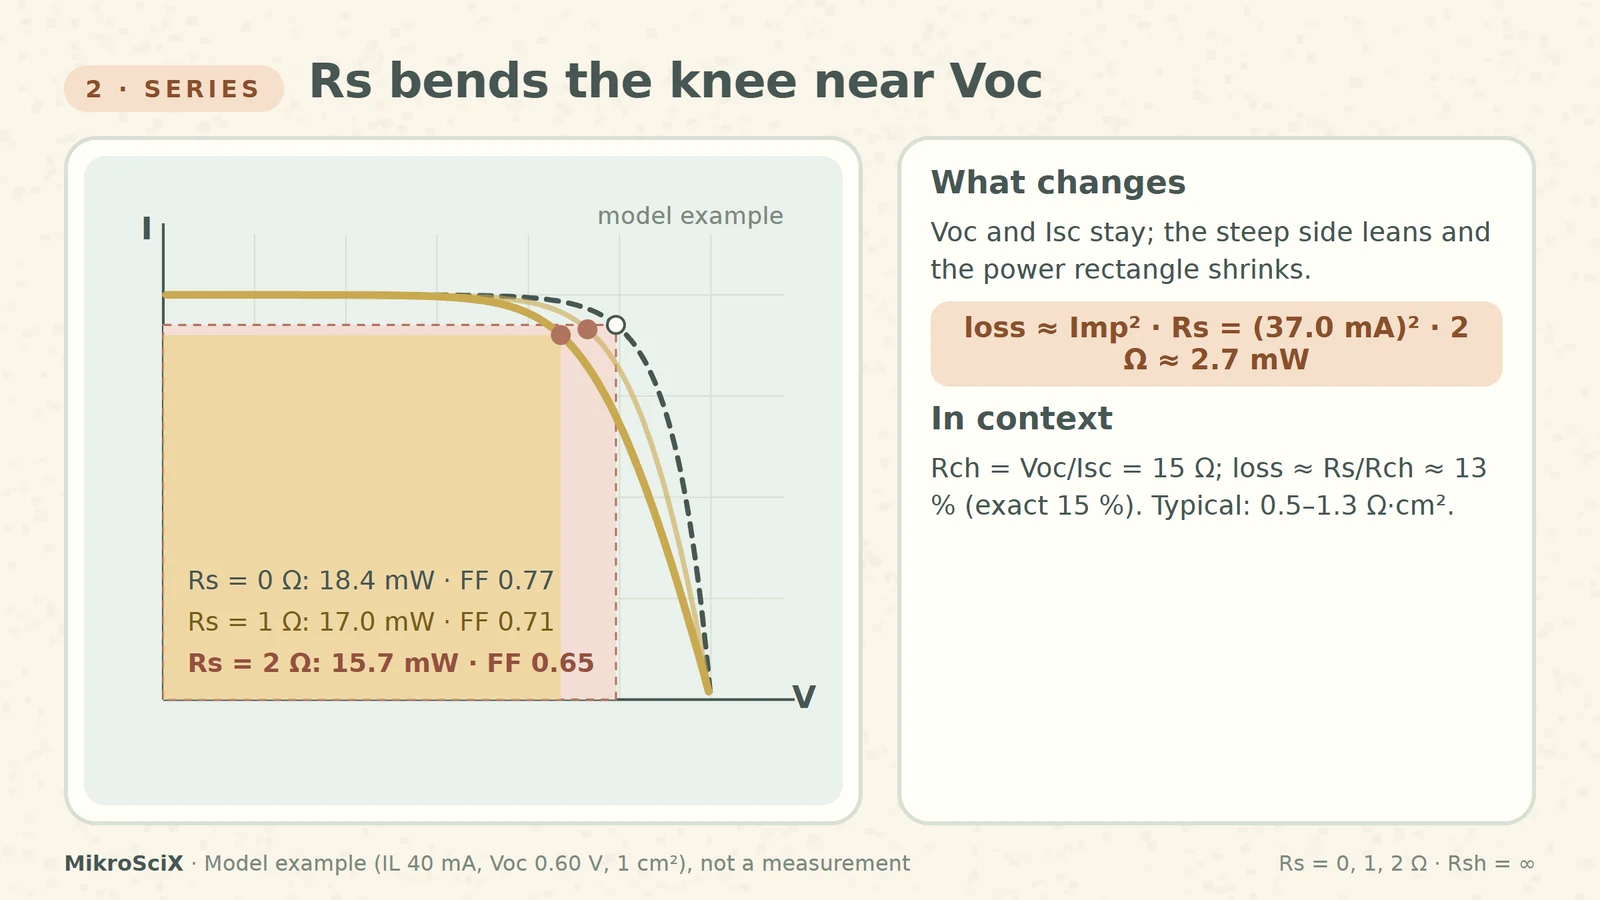
At open circuit no current flows, so Rs has no effect on Voc itself. Near Voc, where the current rises fast, the drop I·Rs pushes the curve to lower voltages and the steep side leans over. The short-circuit current is unaffected unless Rs becomes very large [S1]. The result is a smaller maximum-power rectangle: a lower fill factor and a lower Pmax [S1][S9].
Check it yourself. In the model, Rs = 1 Ω gives Pmax = 17.0 mW (FF 0.71) and Rs = 2 Ω gives 15.7 mW (FF 0.65): about 15 % less power with the same Voc and Isc. A quick estimate: the power lost in Rs is about Imp² × Rs = (37.0 mA)² × 2 Ω ≈ 2.7 mW, close to the exact 18.4 − 15.7 = 2.7 mW.
Put it in context. PVEducation compares Rs with the characteristic resistance Rch ≈ Voc/Isc; the fractional power loss is roughly Rs/Rch [S3]. Here Rch = 0.60 V / 40 mA = 15 Ω, so 2 Ω predicts about 13 %, near the exact 15 %. Typical area-normalised values are 0.5 Ω·cm² for laboratory cells up to 1.3 Ω·cm² for commercial ones [S1].
What breaks: large cells. Rch scales inversely with current, so a 10 A wafer has an Rch of only about 0.07 Ω: a lead resistance of 30 mΩ is negligible for a module but catastrophic for a single cell [S3].
3. Shunt resistance tilts the top near Isc
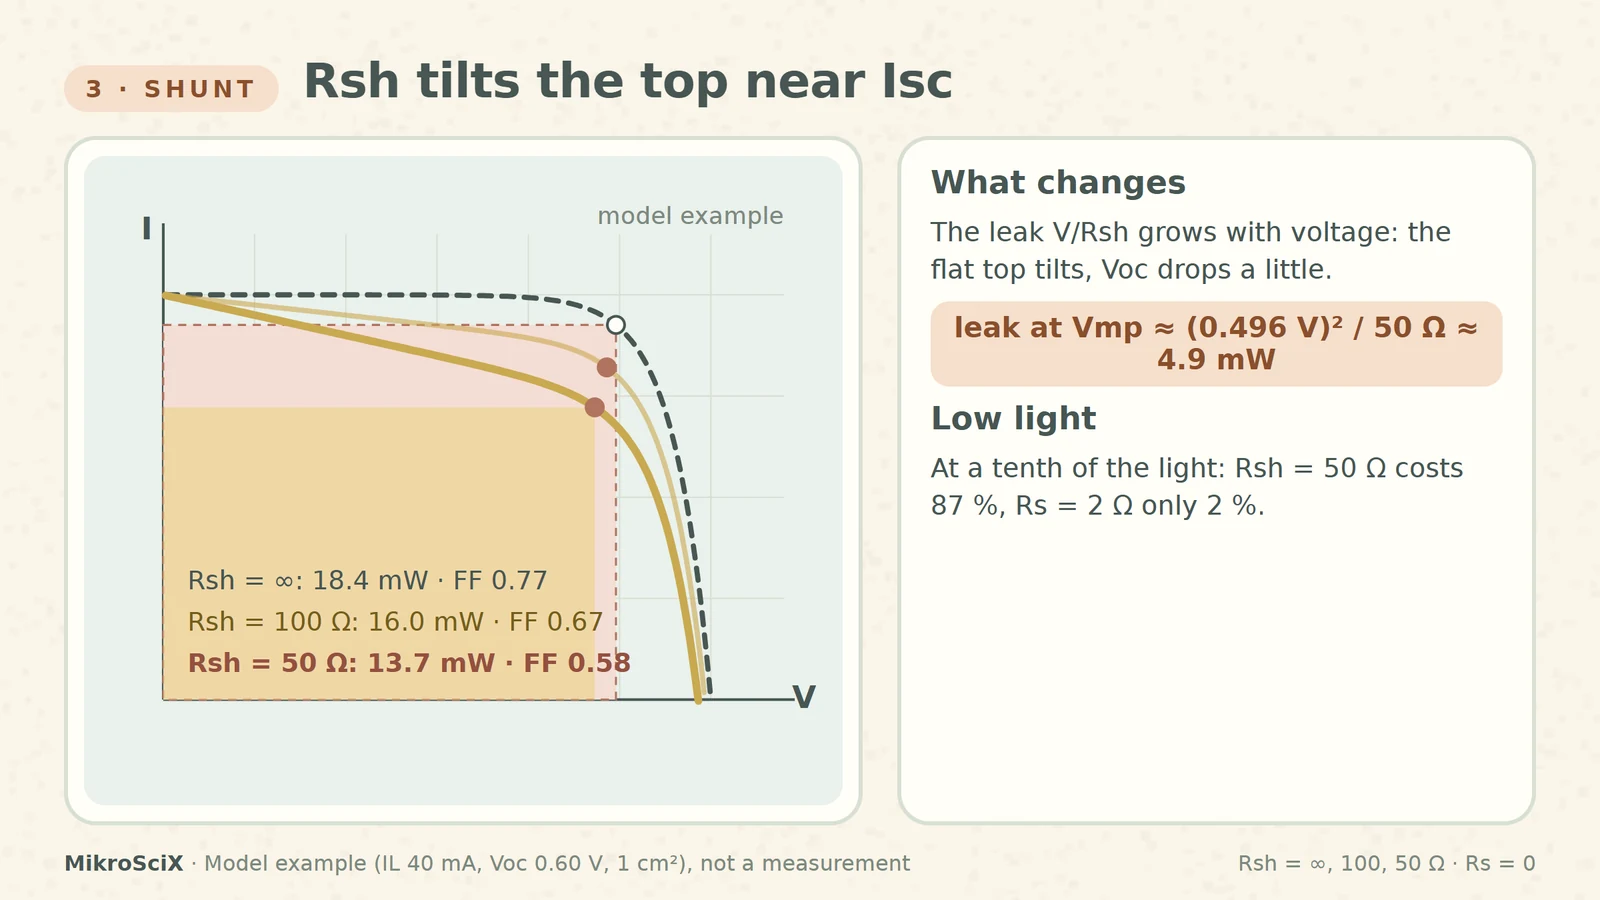
A low shunt gives the light-generated current an alternative path. Less current flows through the junction and out to the load, and the voltage drops too [S2]. On the curve, the flat top near Isc tilts downward, because the leak current V/Rsh grows with voltage; Voc moves down a little and the fill factor falls [S2].
Check it yourself. Rsh = 100 Ω gives Pmax = 16.0 mW (FF 0.67); Rsh = 50 Ω gives 13.7 mW (FF 0.58) and Voc = 0.586 V: about a quarter of the power is gone. The leak at the ideal maximum-power voltage is about Vmp²/Rsh = (0.496 V)² / 50 Ω ≈ 4.9 mW, close to the exact loss of 4.7 mW. In Rch terms the loss is roughly Rch/Rsh = 15/50 = 30 % [S3].
Low light makes it worse. The shunt steals a current set by voltage, not by light, so it matters most when the light current is small [S2]. Model check at a tenth of the light (IL = 4 mA): the ideal cell gives 1.50 mW, with Rsh = 50 Ω only 0.20 mW, 87 % less. Rs = 2 Ω at the same low light costs only 2 %.
What breaks: judging a shunt from a full-sun curve alone. A cell that looks acceptable at 1000 W/m² can collapse at dawn. Typical area-normalised shunts are in the MΩ·cm² range for laboratory cells and about 1000 Ω·cm² for commercial cells [S2].
4. Slope estimates, and why they overestimate
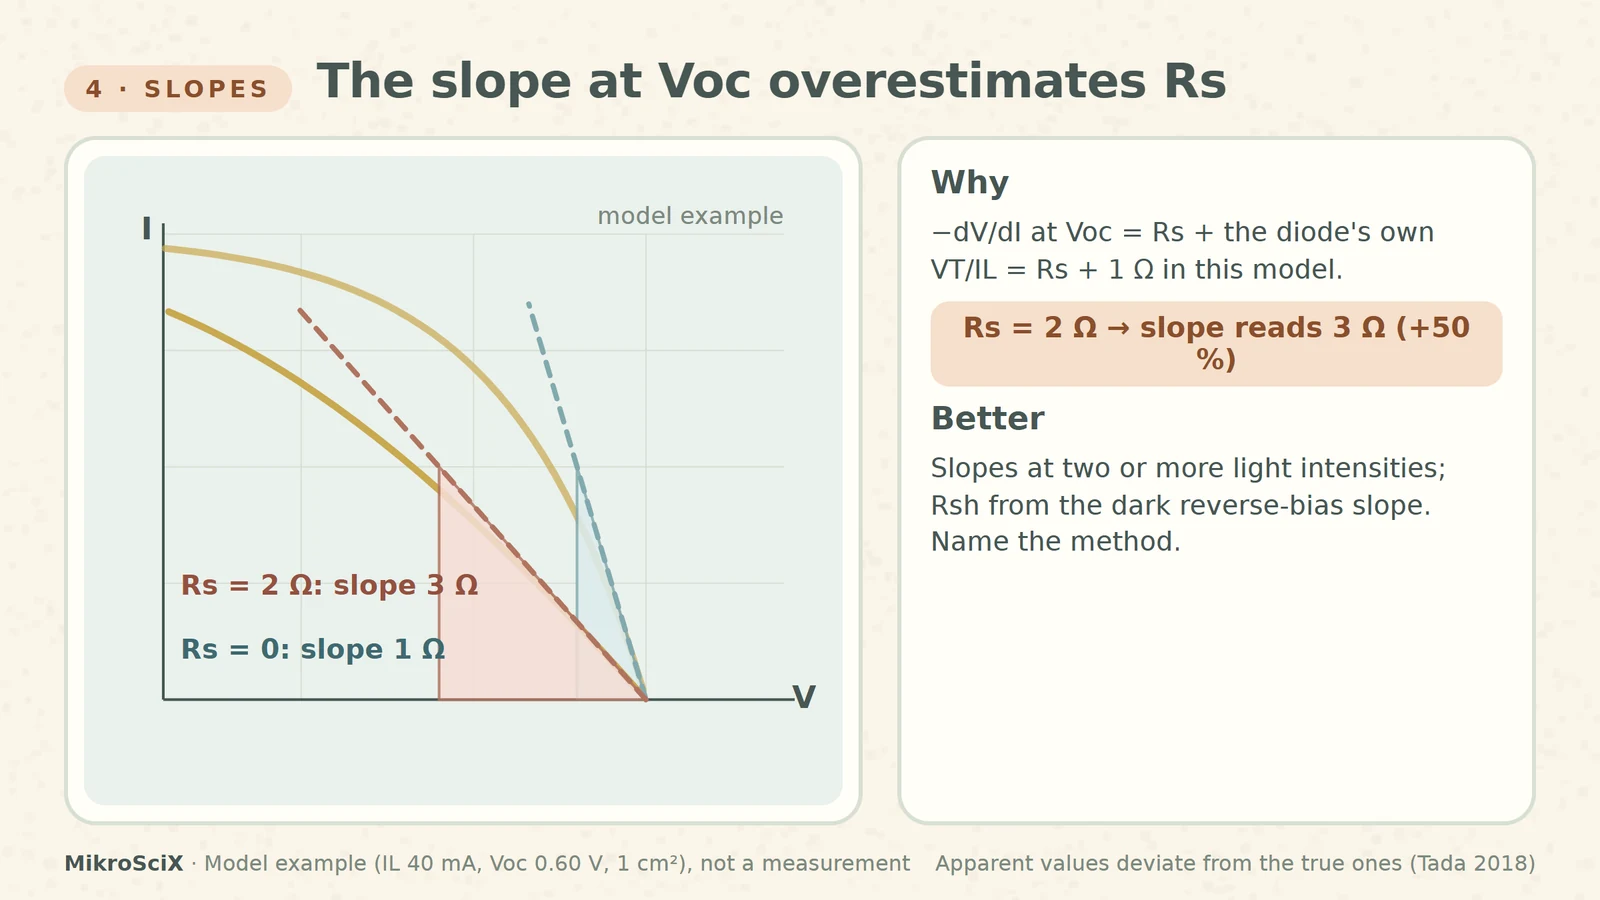
The quick method: the inverse slope of the curve at Voc estimates Rs, and the inverse slope near Isc estimates Rsh [S1][S2][S7]. It is fast and often good enough to compare cells from the same process. But the apparent values are not the model values: an exact analysis shows they deviate significantly from the true Rs and Rsh [S8].
Check it yourself. At Voc the slope −dV/dI is Rs plus the diode's own dynamic resistance. For the model cell that is VT/IL = 0.04 V / 40 mA = 1 Ω. So a cell with Rs = 0 already shows 1 Ω, and a cell with Rs = 2 Ω reads 3 Ω: a 50 % overestimate. The shunt adds to it as well: with Rsh = 50 Ω and Rs = 0 the slope at Voc is 1.38 Ω. Near Isc the same cell with Rs = 2 Ω and Rsh = 50 Ω reads 52 Ω instead of 50 Ω.
Better methods use more than one curve. Keithley's application note fits the far-forward slope of I–V curves measured at two or more light intensities; the inverse slope gives rs [S6]. For the shunt, it uses the linear part of the dark reverse-bias curve [S6]. PVEducation warns that even curve fitting assumes a constant Rs, which is rarely true in practice [S5].
What breaks: reporting the slope at Voc as "the series resistance". Say "apparent Rs from the slope" and name the method.
5. The dark curve separates the two
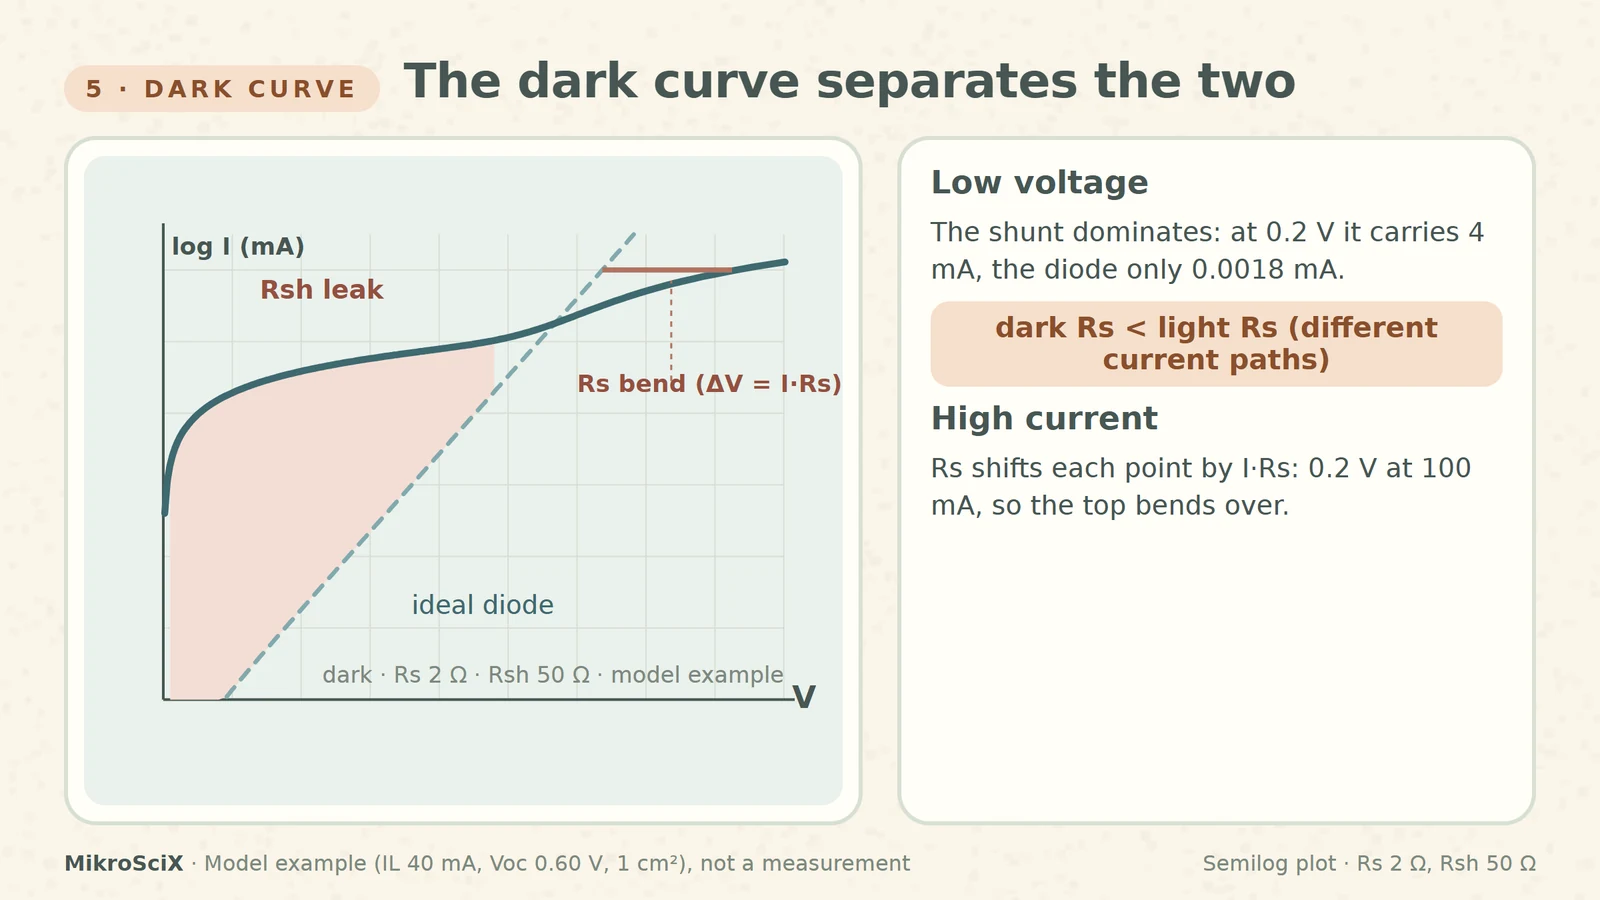
In the dark the cell is a large diode, and a semilog plot of its current shows regions dominated by different loss mechanisms [S4]. An ideal diode is a straight line on log current. A low shunt adds V/Rsh, which dominates at low voltage, where the diode current is tiny [S2]. Series resistance shifts each point by I·Rs, which only matters at high current, so the top of the curve bends over.
Check it yourself. At 0.2 V the model diode carries I0(e5 − 1) ≈ 0.0018 mA, while a 50 Ω shunt carries 0.2 V / 50 Ω = 4 mA: more than two thousand times more. At 100 mA a 2 Ω series resistance adds 0.2 V to the voltage.
What breaks: assuming the dark and light curves share the same Rs. In the dark the current flows in the opposite direction and takes different paths; most of it crosses the junction under the contacts, so the dark series resistance is lower than under light [S4].
6. Two wires add their own series resistance
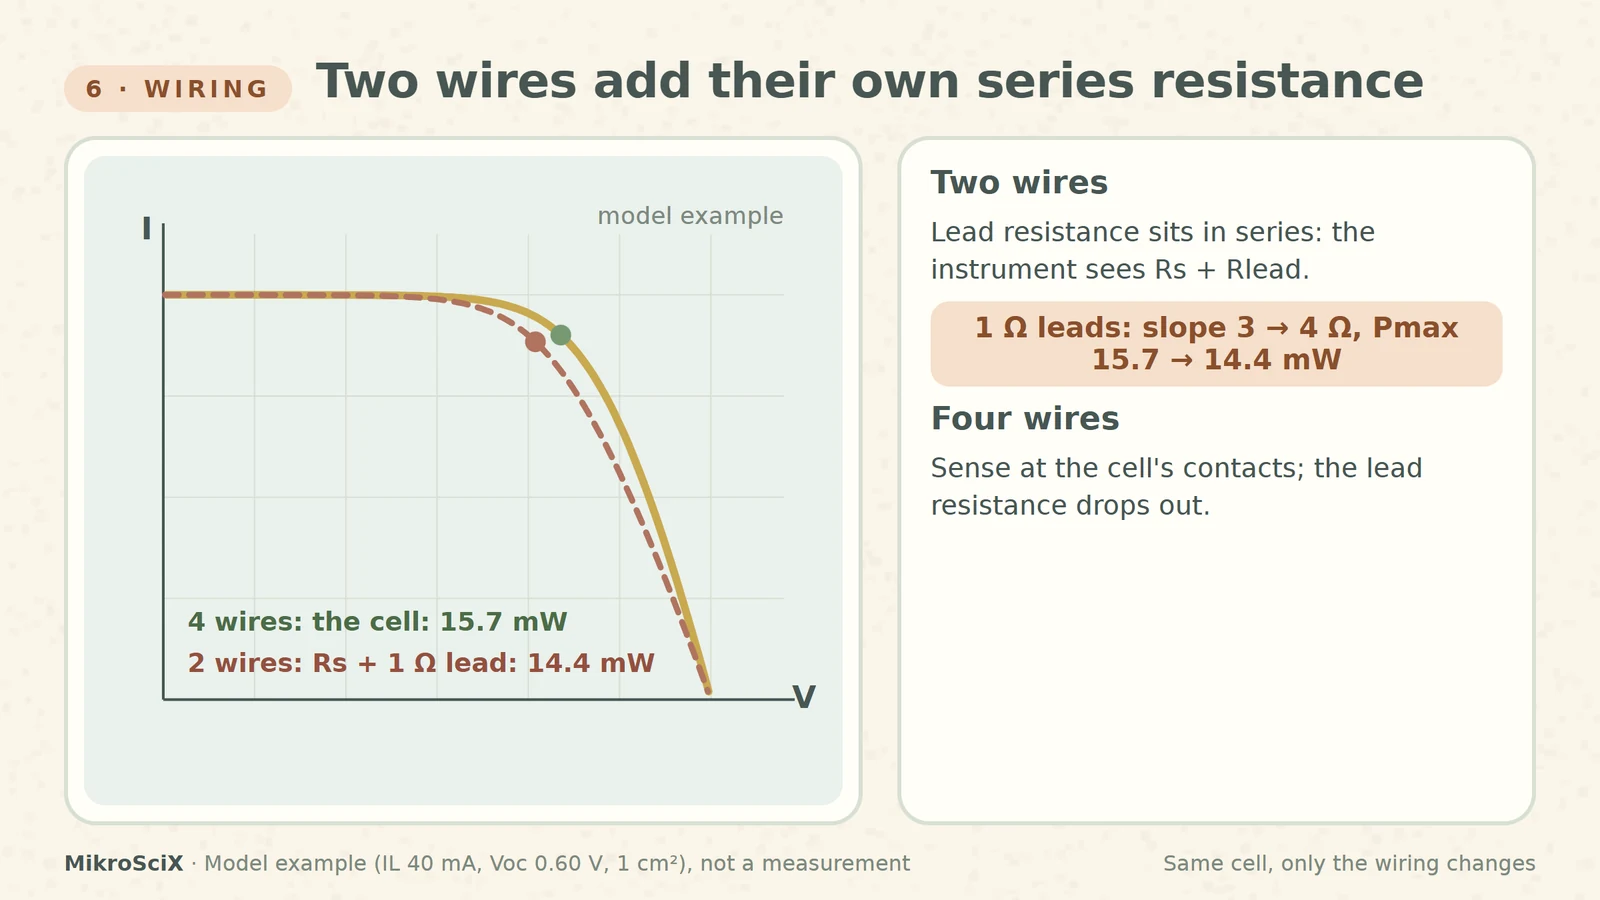
In a two-wire measurement the same leads carry the current and measure the voltage. Their resistance sits in series with the cell, so the instrument sees Rs + Rlead. A four-wire connection senses the voltage at the cell's contacts and compensates for the lead resistance [S6].
Check it yourself. Add 1 Ω of leads to the Rs = 2 Ω model cell: the slope at Voc rises from 3 Ω to 4 Ω and the apparent Pmax drops from 15.7 mW to 14.4 mW, with no change in the cell. The smaller and higher-current the cell, the worse this gets [S3].
Before you report Rs or Rsh
- Wiring: four wires, sense on the cell's own contacts.
- Units: give resistances in Ω·cm² so cells of different areas compare [S9].
- Method: say "slope at Voc" or "two intensities" or "fit"; a slope is an upper estimate.
- Light level: check the shunt at low light too.
- Dark curve: look at it on a log scale; remember its Rs is lower.
Series resistance bends the knee near Voc, shunt resistance tilts the top near Isc, and both cost fill factor. Slopes give a first guess, not the answer.
Try it yourself
- A model cell has Rs = 1 Ω. What slope do you read at Voc? About 1 Ω + 1 Ω = 2 Ω (Rs plus VT/IL).
- Estimate the power lost in Rs = 1 Ω at Imp ≈ 37 mA. (37 mA)² × 1 Ω ≈ 1.4 mW; the model gives 18.4 − 17.0 = 1.4 mW.
- Which loses more at a tenth of the light, Rs = 2 Ω or Rsh = 50 Ω? The shunt: −87 % against −2 % in the model.
- A 156 mm cell has Rch ≈ 0.07 Ω. Is 0.03 Ω of lead resistance negligible? No: 0.03/0.07 ≈ 40 % power loss, far outside the small-loss range [S3].
Watch the short
Videos don’t load automatically. The videos are hosted on YouTube. Allow YouTube once and every video on the site loads by itself; your choice is remembered. The articles never need consent.
Sources
- PVEducation (C. Honsberg, S. Bowden) — Series Resistance
- PVEducation — Shunt Resistance
- PVEducation — Characteristic Resistance
- PVEducation — Dark IV Measurements
- PVEducation — Measurement of Series Resistance
- Keithley / Tektronix — Application Note 3026: Electrical characterization of photovoltaic materials and solar cells with the Model 4200-SCS
- TU Delft OpenCourseWare (A. Smets) — Solar Cell Performance
- K. Tada — What do apparent series and shunt resistances in solar cell estimated by I–V slope mean? physica status solidi (a) 215 (2018)
- PVEducation — Effect of Parasitic Resistances
Diagrams are schematic. All curves and numbers come from one single-diode model (IL 40 mA, Voc 0.60 V, 1 cm²) with deliberately large example resistances; they are illustrative, not measurements.